Plexporters, Energize: How we monitor Plex with Grafana
As a Grafanista, you tend to find things to visualize — databases, microservices, classic video games, etc. It’s part of our “big tent” philosophy. So when our December hackathon rolled around, some of us in our internal homelab Slack channel decided to take a look at how we could get metrics out of our Plex Media Servers.
We all run servers that we share with friends and family, and we were curious about finding better ways to understand:
- What content is popular or stale and could be deleted
- When are popular times for watching so we can minimize interruptions
- If we’re getting the best experience without stressing the hardware
At first, we looked at Tautulli, which many Plex admins are already familiar with. It’s a powerful tool that helps monitor your server and record various statistics — and more. Much more. In fact, its feature set can be a little overwhelming.
We wanted a simple way to get metrics into Prometheus, as well as the building blocks to compose dashboards, but nothing we looked at seemed to satisfy our needs. Add it all up and it looked like we got ourselves a project!
Next came the most difficult part, naming it. After much deliberation — and nearly missing the deadline — meet The Plexporters!

It’s like Tautulli, but for Grafana
With only a week to complete our hackathon project, we decided to try to replicate the Tautulli graphs, which breaks down playbacks into a number of useful dimensions. Some questions that we wanted to answer included:
- What content is popular amongst the friends that we’ve given access to? This can help identify content that could be optimized for a better streaming experience.
- What client platforms are used? Some clients are better than others at direct-playing content.
- Who is making the most use of our server? Are we serving primarily local traffic, or could remote streams be clogging up our upstream bandwidth?
The first thing we needed to do was design the metrics we wanted to export.
For playback metrics, Tautulli shows us both playback time and count. We were able to represent this by exporting play_seconds_total and plays_total metrics. Decorating the metrics with labels allows us to visualize playbacks however we want!
Next we need to tap into Plex’s websocket to “watch” what’s happening on the server. This is the same mechanism that Plex’s own dashboard uses to render real-time notifications to clients. Some events need to fetch more data from the server to render all the labels. Others need to be aggregated within the exporter in order to form cohesive metrics around playback sessions.
Finally, we can piece this together into a dashboard. Believe it or not, the following charts are all generated using the same metric!
Titles by duration

Here we are able to find out what our most popular content is within a given window. Summing the play_seconds_total metric and grouping by the title gives us the basic graph. Thanks to the labels exported with the metrics we’re able to also display if the content is a TV show or a movie.
One divergence from Plex’s paradigm that helps us out is that we reversed the media type hierarchy from parent and grandparent to child and grandchild. With the former, the leaf nodes are the items to display, but what we want is for the root nodes to be the primary data point; we care more about the show being played than the individual season or episode. Those details still exist in the exported labels, but the change makes rendering graphs like this much more straightforward.
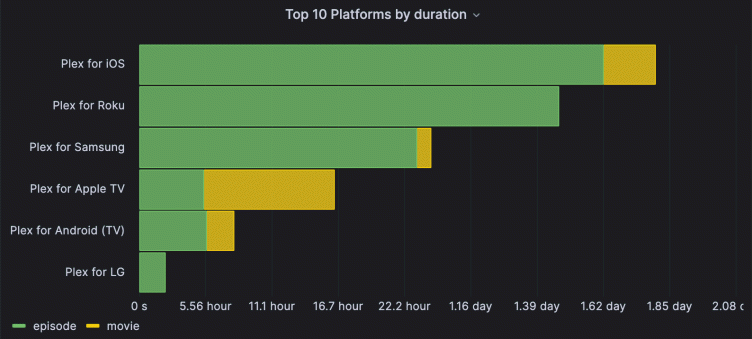
Platforms by duration

This dashboard helps answer the question “What devices are people using?” It’s built on the exact same metric as the top titles graph — play_seconds_total! By grouping on device_type, it helps us answer an entirely different question. If someone wanted to dig deeper into specific devices being used, that is also exposed as a label.
Duration by source resolution

Part of the magic of Plex is that it allows you to store a single media file and consume it on a variety of devices using its natively supported codecs while only taking up a relatively small amount of your bandwidth. For example, given a single, large H.265 MKV file, Plex can transcode it on-the-fly into a 4Mbps, H.264 MP4 file for native playback on a device streaming from a cellular connection.
That’s great, but just because you can doesn’t mean you should. If your server is able to make use of hardware accelerated transcoding, it may not be an issue. Transcoding on the CPU can, however, easily bring even the beefiest servers to their knees. In the above chart, we can see a non-zero amount of 4K content being transcoded. Due to its size and codec, even with hardware acceleration this will limit the capacity of the server to serve others.
Challenges
As we designed the metrics and built our dashboard, we realized that media servers operate differently than other server types, such as web servers. Their content and usage pattern is prone to high cardinality and many one-off events, and we needed to ensure these were accommodated upfront.
Cardinality
When exporting metrics, cardinality is important an important consideration. A media server with a lot of content and users contains many high-cardinality values such as user name, movie title, and episode number. Using these values as metrics labels can lead to a very high number of active series unless they’re properly managed.
Typically, when an application has metrics, it exports them for the life of the application. This works well for things like HTTP error counts on a web server that keep occurring, but the usage pattern of media on a Plex server is different. Media is usually consumed sporadically, with popular new releases consumed regularly to start, and then less frequently as time goes on. This means that playing a video could unintentionally populate a metric that could last for weeks or months, even if it was never played again. To prevent this, we used the Prometheus Go Client library to export a dynamic set of metrics that automatically removes entries when they go stale. This keeps the number of active series small, improves performance, and reduces cost.
To dig a bit deeper, let’s compare approaches. We can create and then populate a simple play counter with two labels for the video title and episode number using the standard promauto method:
   // Startup
   metricPlayCount = promauto.NewCounterVec(prometheus.CounterOpts{
       Name: "play_count",
   }, []string{"title", "episode"})


   // When a play event is received
   metricPlayCount.WithLabelValues(title, episode).Inc()
If we played three videos, the application would export metrics like this:
play_count{title="video1",episode="1"} 1 <timestamp>
play_count{title="video2",episode="2"} 1 <timestamp>
play_count{title="video3",episode="3"} 1 <timestamp>
Herein lies the concern. These metrics will continue to be exported until the application is restarted, even if the videos are never played again, taking up space in our metrics database and wasting resources. If we added all the labels we really wanted — genre, user name, bitrate, resolution, etc. — we would have a cardinality explosion and stale metrics.
Instead we went with an approach that exports metrics dynamically and allows us to prune them when they go stale. This is done by creating a metric description and then using it to export on-the-fly during the scrape process. All of this is available in the Prometheus Go client library.
   // Startup
   metricPlayCountDesc = prometheus.NewDesc(
       "play_count",
       "Total play counts",
       []string{"title", "episode", ... <many more labels> },
       nil,
   )

   server := NewServer(...)
   metrics.Register(server)


   // Called automatically when the /metrics endpoint is scraped
   func (s *Server) Collect(ch chan<- prometheus.Metric) {
	for _, session := range activeSessions {

          // Export a play count for each active session
          ch <- prometheus.MustNewConstMetric(
              metricPlayCountDesc,
              prometheus.CounterValue,
              value,
              session.title, session.episode, ... <the other labels>
              )
       }
   }
If we played three videos, the application would export metrics like before:
play_count{title="video1",episode="1"...} 1 <timestamp>
play_count{title="video2",episode="2"...} 1 <timestamp>
play_count{title="video3",episode="3"...} 1 <timestamp>
But then after a while when the sessions are no longer active, the metrics are no longer exported, leading to happy downstream systems.
 // Later: metrics for videos1,2,3 are no longer exported
play_count{title="video4",episode="4"...} 1 <timestamp>
Aggregating rare events
As described in the previous section, metrics for media consumption do not follow the same patterns as other systems like API servers, and they’re often measuring sporadic and unique events. This presents a small caveat when writing PromQL queries to aggregate over them.
Let’s say we want to calculate the total play count per user. Instinct causes us to reach for a query like:
sum(increase(play_count[$__rate_interval])) by (user)However, this doesn’t work as you might expect and returns all zeros. Because our metrics for play counts start at the value 1, which is when the user plays something, there is technically no increase occurring. Our metrics are being created at the value 1 and then staying there. We can work around this by simply adding 1.
sum(increase(play_count[$__rate_interval])+1) by (user)What’s next?
Over the span of the hackathon, we managed to build something useful for monitoring a media server, but there’s a lot more room to grow. Here are just some of the changes we look forward to adding:
- Auto-magical Plex login and server discovery.
- Alerts based on metrics such as media transcoding or clients streaming the default 720p resolution.
- Compatibility with other media servers, such as Jellyfin or Emby.
- Stand-alone binary releases and ARM-compatible builds.
- More dashboard components.
The Prometheus Plex exporter project has been open sourced so the community can help improve it and fit their needs. We had fun working together on this homelab project, and we look forward to seeing how others can contribute to continue to expand its capabilities.


