
Multiple players, one stack: Inside Roblox's centralized observability stack
When you sign into the Roblox platform, you get 30 million immersive experiences, ranging from concerts to fashion shows to, of course, video games.
But when the observability team at Roblox logs on, they’re not playing around. The Roblox observability engineers are responsible for keeping more than 214 million monthly users happy and engaged by making the wildly popular gaming platform highly available around the world.
“Just imagine how sad you or your kids would be if Roblox is slow or unavailable, or your gaming experience is shaky,” Roblox Engineering Director Xiaofeng Han told the audience at the recent ObservabilityCON on the Road event in the San Francisco Bay Area. “We have been working really hard to make our infrastructure scalable, reliable, and intelligent.”
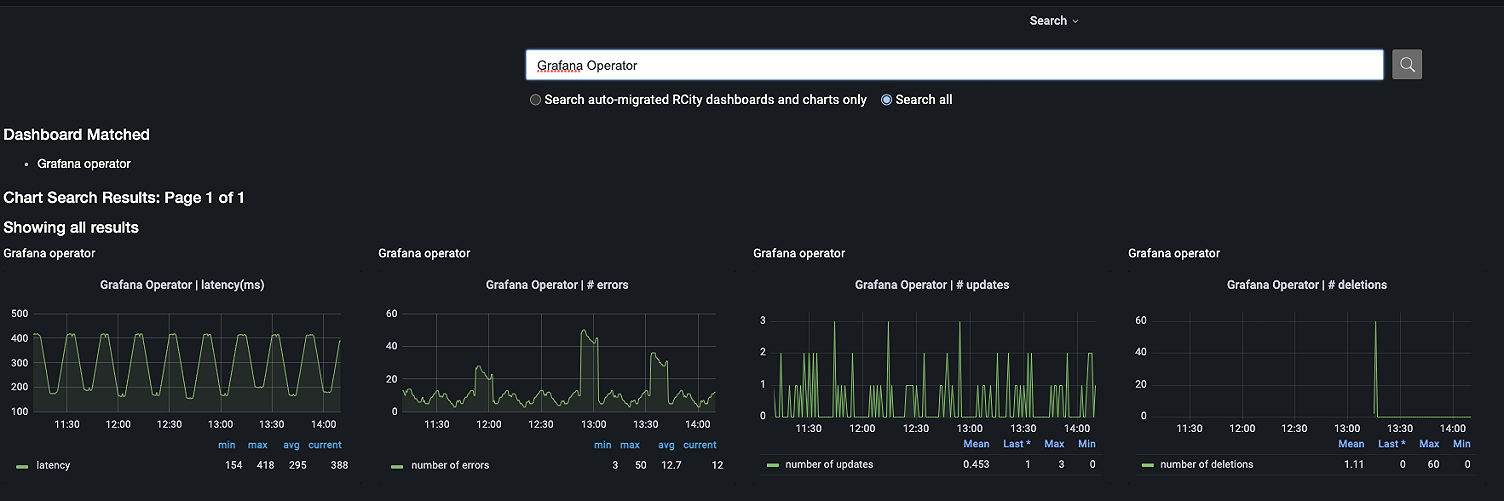
Not to mention centralized. In their recent talk “The journey to unified and intelligent observability infrastructure at Roblox” (which is now available on demand), the Roblox team outlined how they brought together independent observability stacks from across the company into a single hosted visualization platform with Grafana Cloud. They also provided insight into why they recently adopted Grafana Cloud Traces to correlate all of their telemetry data in their Grafana dashboards.
Game over for silos: centralized observability with Grafana Cloud
It makes sense that the Roblox observability journey started with individual users.
Just like the global gaming platform encourages creators to build and share their own unique video games, the teams within Roblox were allowed to monitor their respective apps by deploying an observability stack of their choosing.
“They would spin up their own Prometheus instance or InfluxDB, and they would each have their own Grafana setup,” said Roblox Principal Engineer Ying Dai. Other teams used a metrics pipeline into Amazon DynamoDB and leveraged a custom company visualization tool called RCity. No matter which database they chose, however, the metrics data had to be aggregated into a simple key-value pair. That meant that data visualization was fast and simple, but querying data was anything but that.
Without an observability team in place, “it was kind of like the Wild West,” said Han.
The build-your-own-observability approach proved to be challenging during critical events. Different visualization tools were deployed in different stacks for each application, so on-call engineers didn’t even know where to look when they were trying to resolve incidents. As a result, debugging efforts and overall mean time to repair (MTTR) were slow. It was also hard to add global features across the various stacks. And in order to monitor the players behavior in a new region or country, “we had to do a lot of hacky things and extreme parsing around the keys just to get the segmentation for that new region,” explained Dai.
Overall, reliability — or the lack thereof — was the biggest pain point. Roblox has exploded in popularity in the past three years, with recent reports highlighting a 23% annual increase in daily active users in 2022. With the increased traffic to the Roblox metaverse, the observability team experienced exponential growth in metric load ingestion and a greater demand for more dashboards and alerting. But the company’s native RCity visualization tool was reaching its limits and couldn’t support all the new use cases. Says Dai: “We would have outages frequently and we suffered a lot.”
When an observability team was introduced into Roblox about three years ago, they quickly decided it was time to start building their own unified telemetry pipeline and to move the company’s data visualizations onto a single platform for the entire company. “We chose Grafana because we believe it’s scalable enough, flexible enough, and good for our needs,” says Dai.
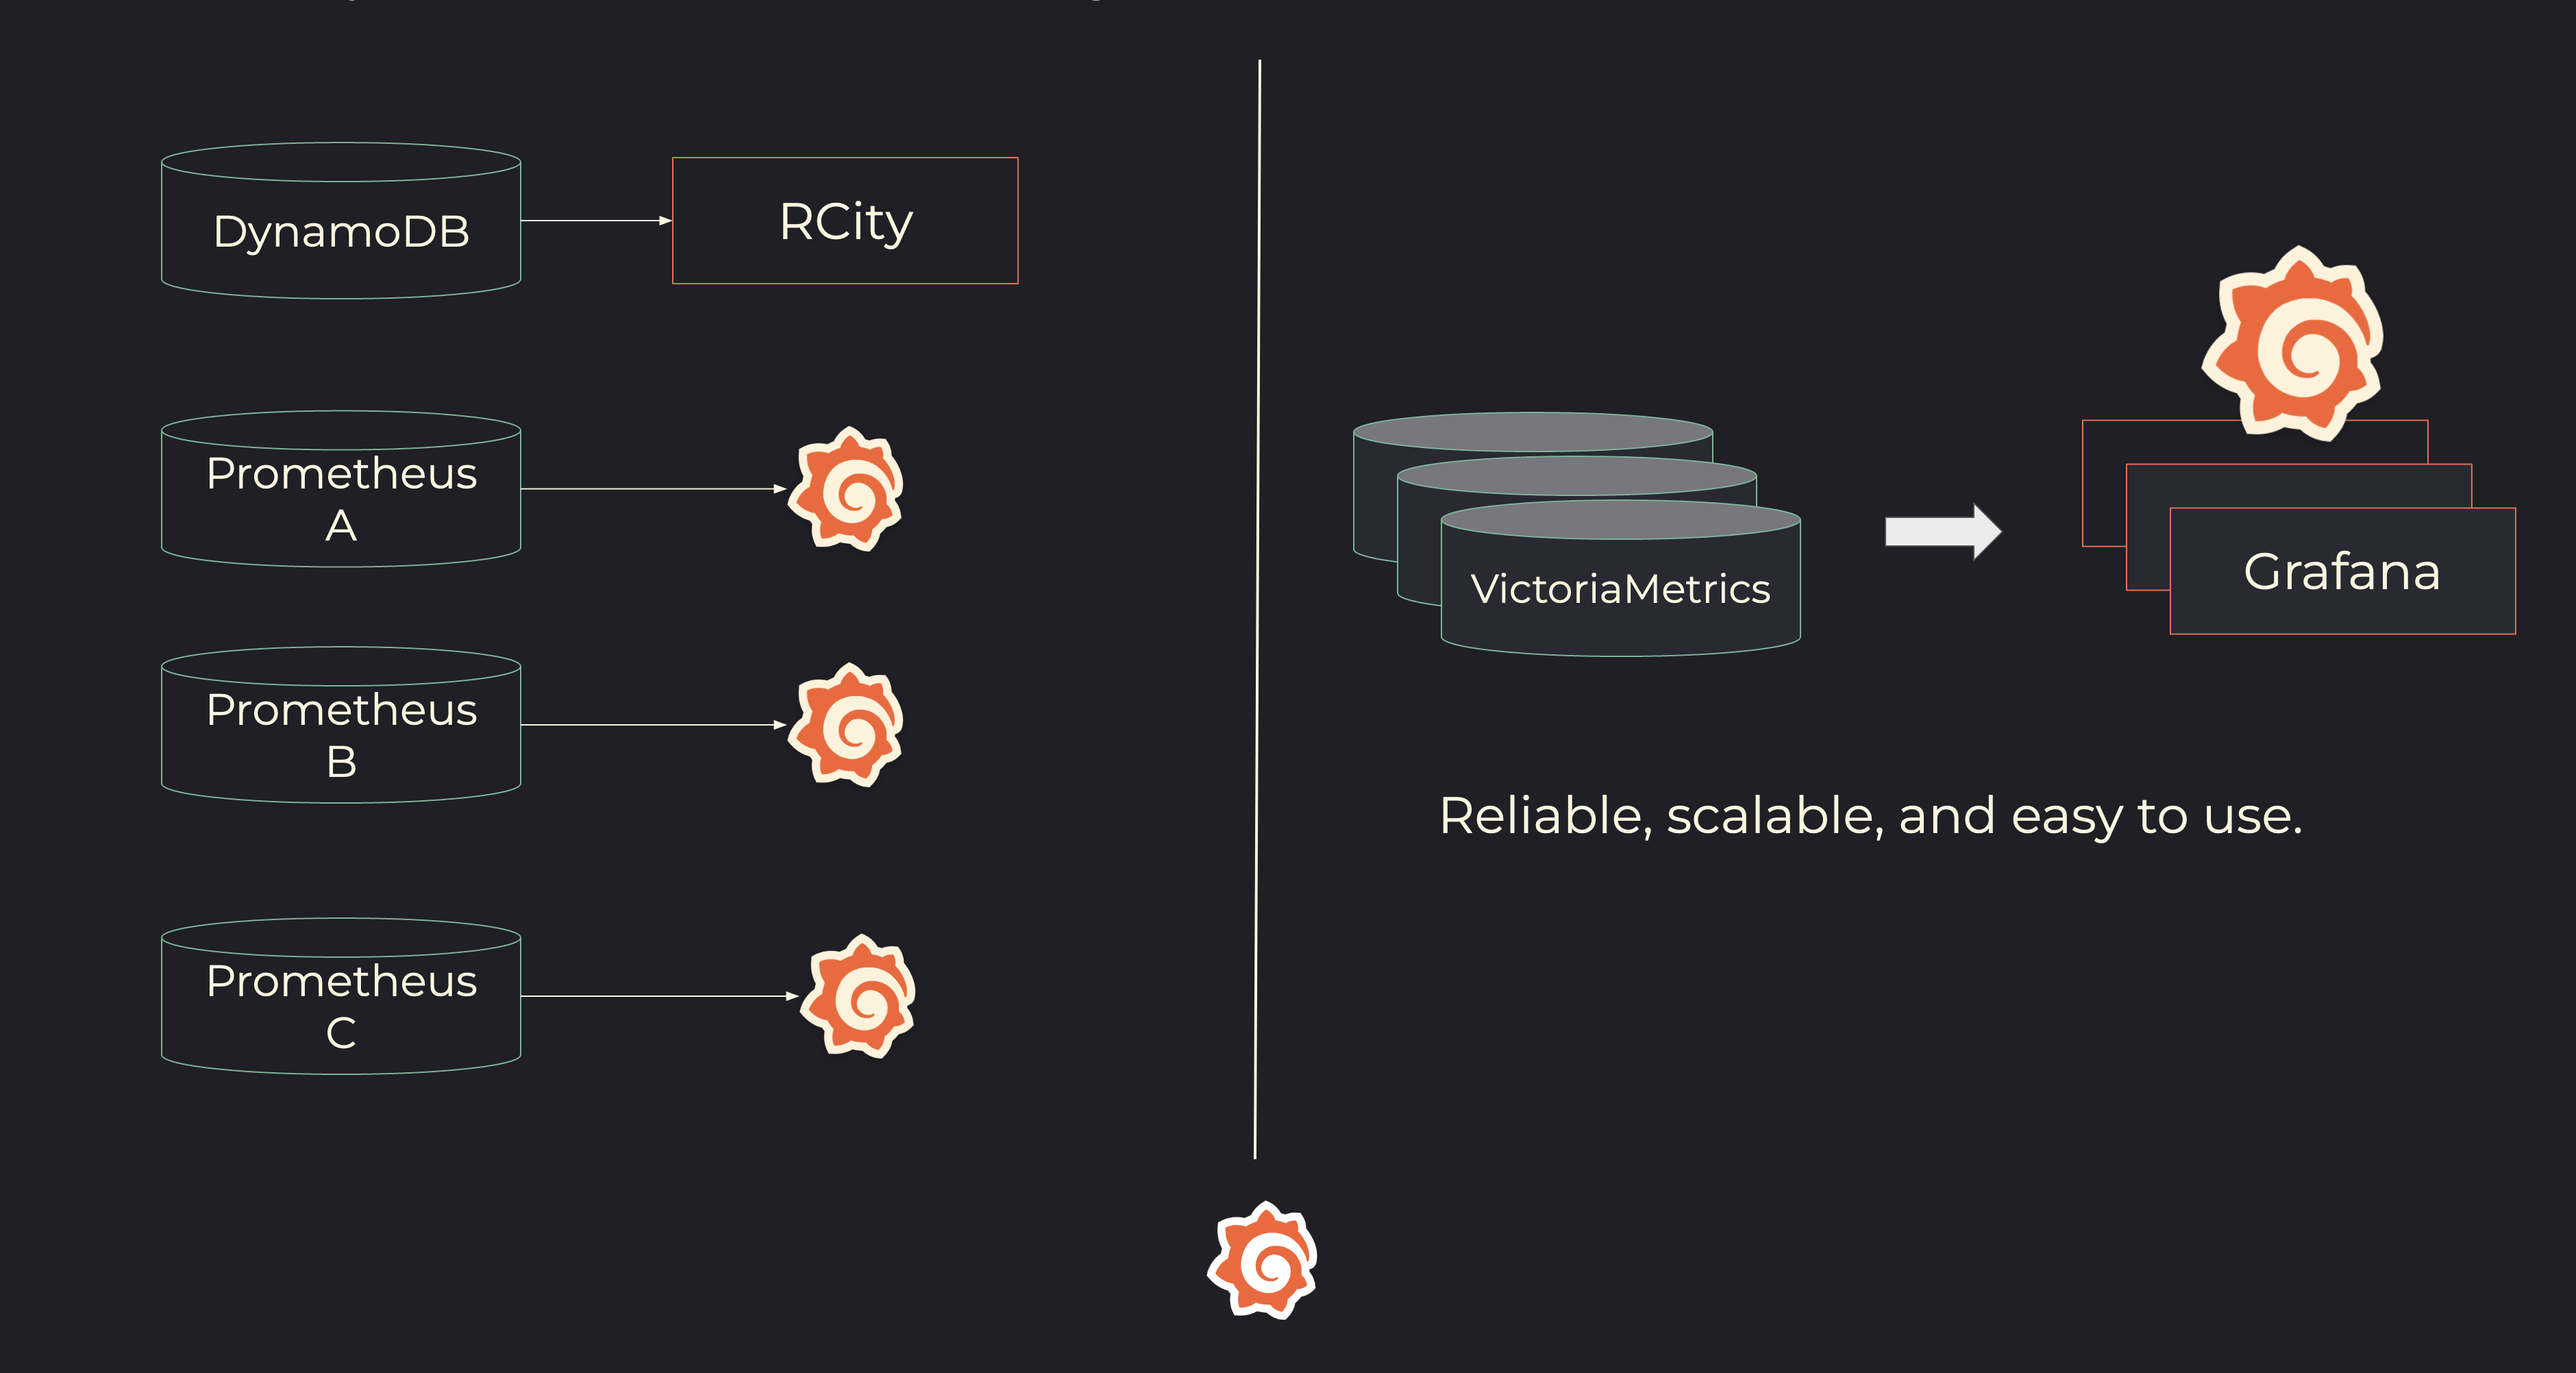
Over the past year, Roblox built its centralized stack, which includes VictoriaMetrics and Grafana Cloud for visualizations. By using one Grafana instance for the entire organization, the observability team now supports more than 17,000 Grafana dashboards, which is four times more than their original native tool. They have also achieved 100% availability for the first three quarters with the new stack in place, despite ingesting more than 120 million data points per second.
Says Dai: “Nowadays, our team is in a much more comfortable position to work on useful features.”
Level up for tracing with Grafana Cloud Traces
For traces, Roblox had deployed Lightstep in their stack, but Han noticed something odd about the engineers’ workflows.
“The funny thing was when we were in a real crisis — when people tried to debug or tried to recover certain systems — they always quickly went back to logs and metrics,” Han said. “They felt fragmented when they had to switch back and forth between two different UIs. This fragmentation caused a lot of frustration, especially when they were fighting a real incident.”
To bridge this gap, the team decided to bring their tracing data into Grafana Cloud Traces. Now, instead of toggling between multiple platforms to get one answer, the Roblox engineers can leverage a single Grafana dashboard for their metrics, logs, and traces — even if they don’t know it.
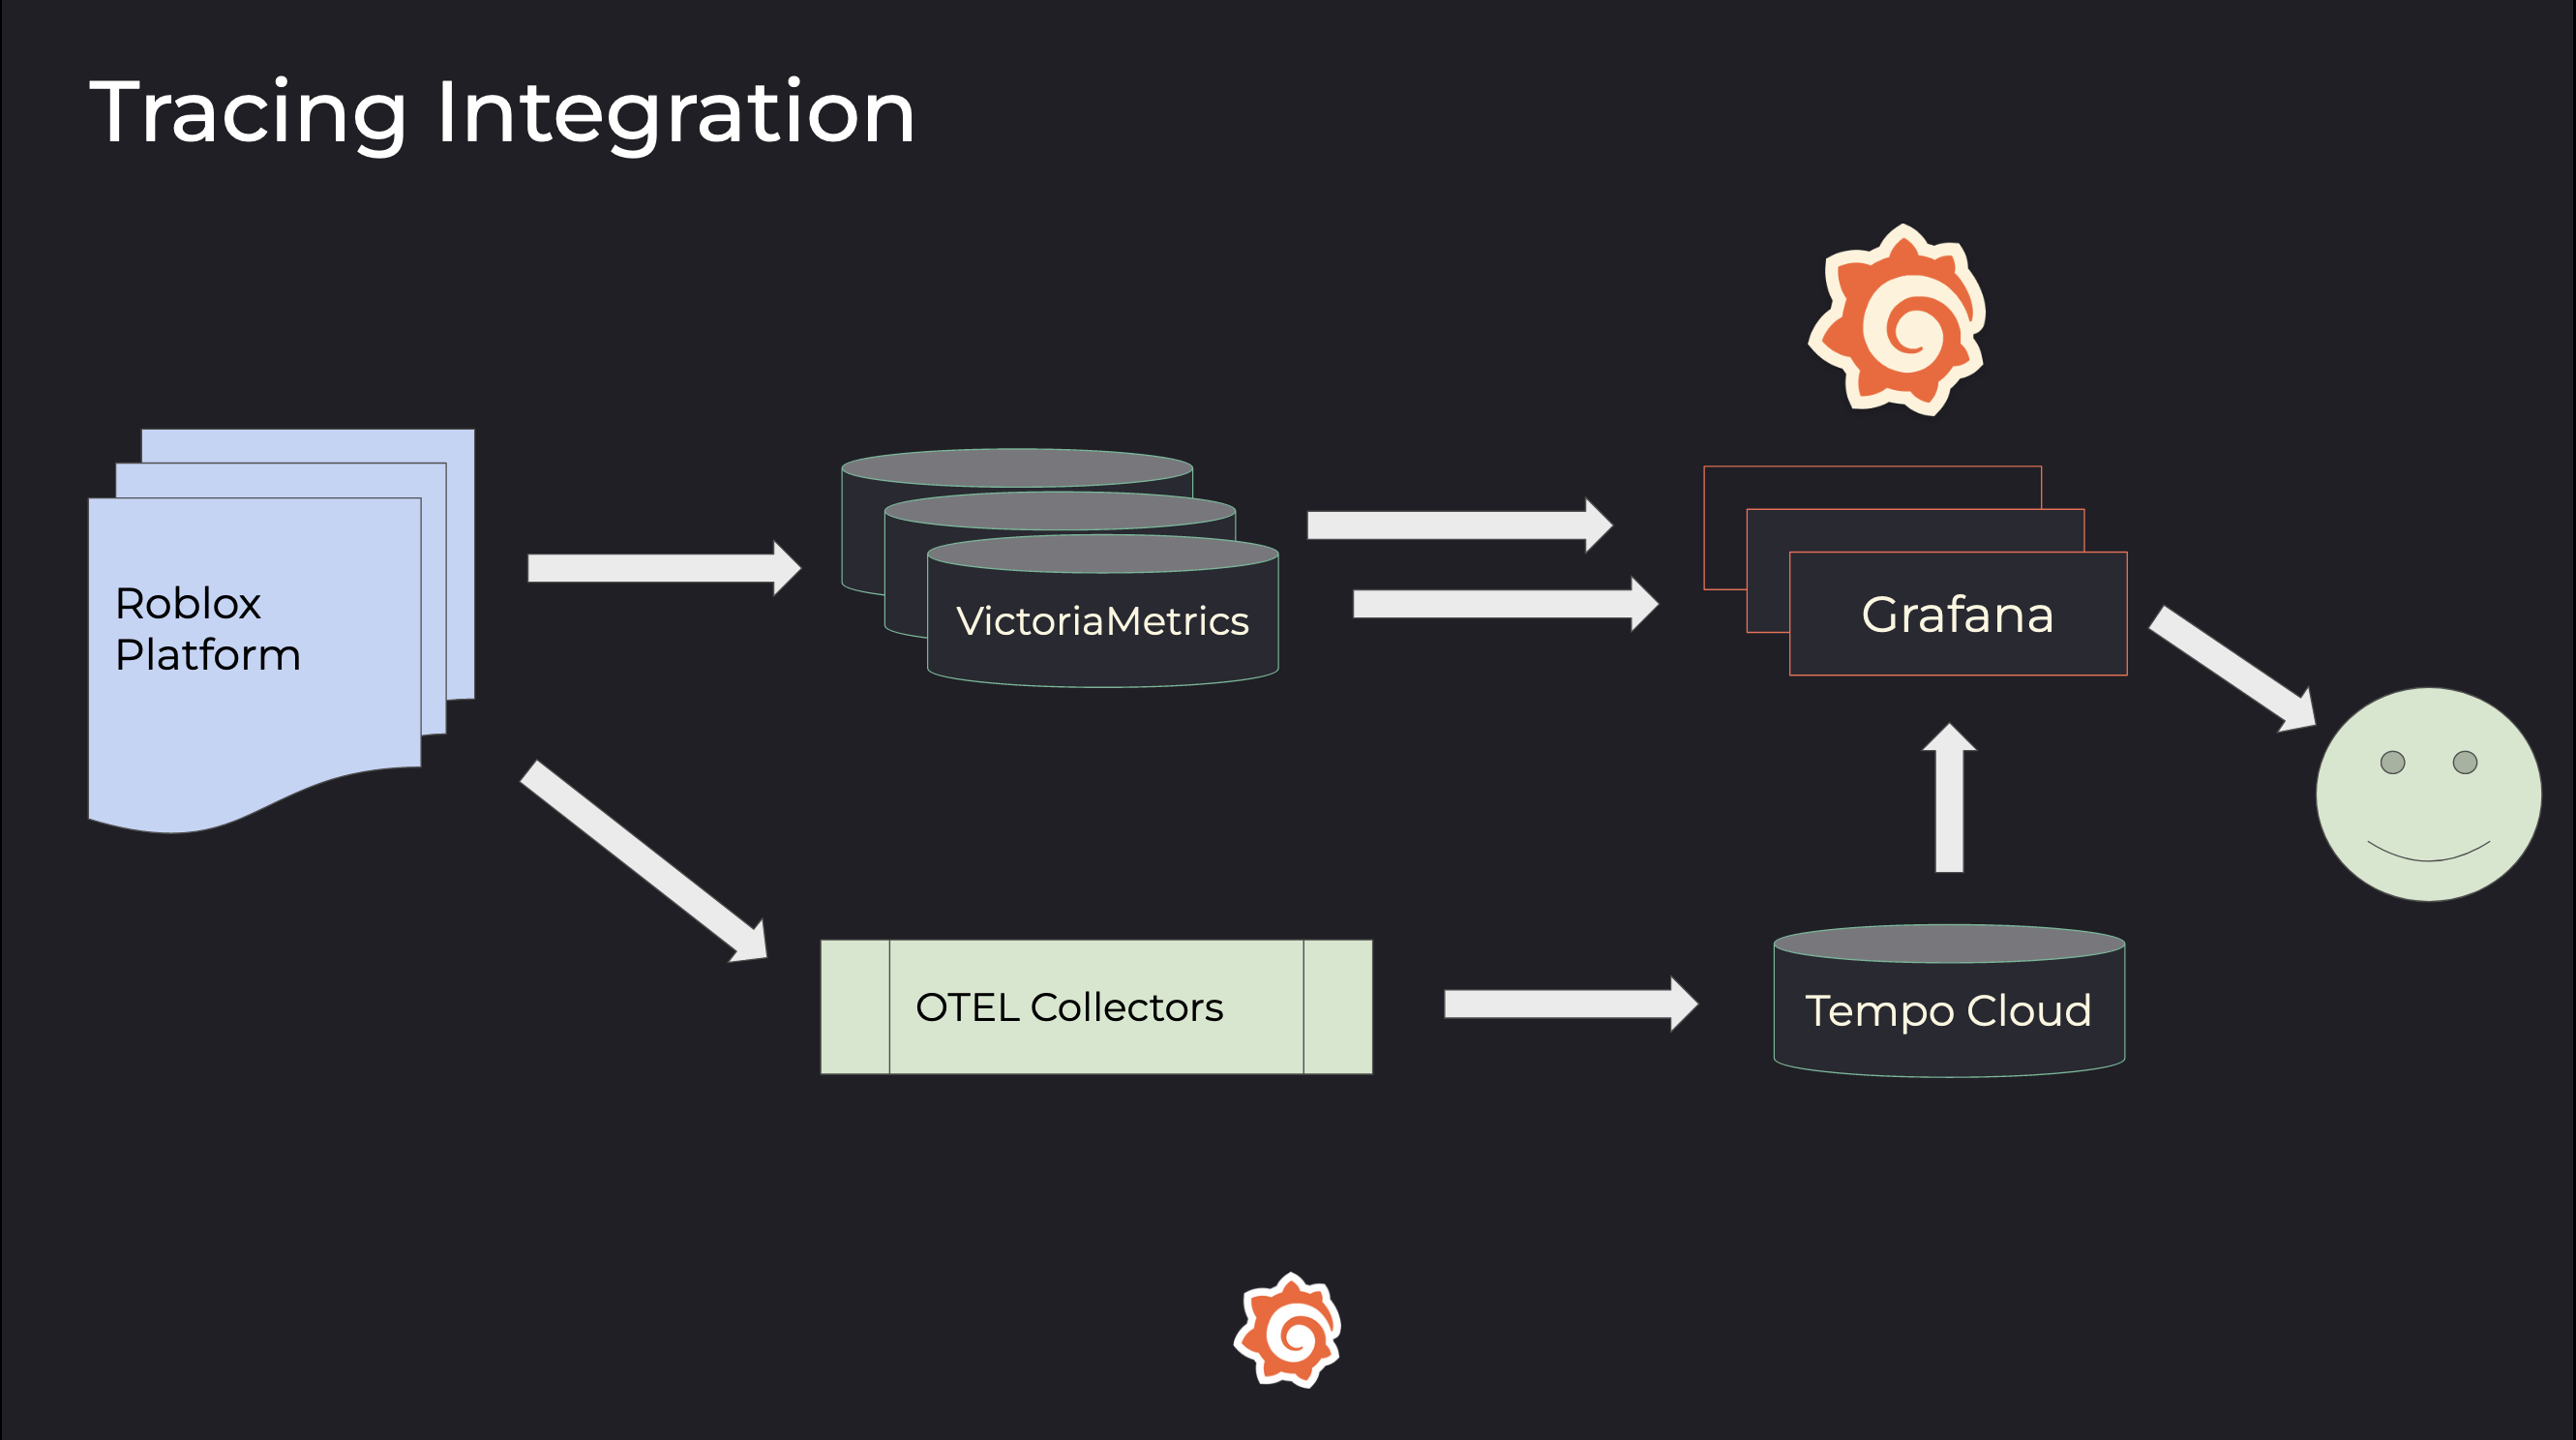
“There’s a Grafana dashboard for each microservice, and sometimes people don’t really realize this is actually the tracing data, logs, and metrics,” said Han. “They just feel that everything I want to know about this service is right here in Grafana and I can check in whenever I want to.”
With an eye towards developing a powerful root cause analysis engine in the future, Han said the team continues to be “passionate” about the benefits of their migration and their overall centralized observability strategy.
“It’s not about how much data you store in your system,” said Han. “It’s about the true value people can get from all the data.”
To hear more about how Robox centralized their independent stacks across the company and what’s next for their observability strategy, watch their ObservabilityCON on the Road session on demand.