
How Grafana helped a rocket engineering team break a world record
Philip Do is a university student, software engineer, and space enthusiast from Southern California. He currently studies Computer Science and Engineering (CSE) at UCLA, where he is the Electronics Subteam Lead and Avionics Software Lead for Rocket Project, and Webmaster for the Engineering Society at UCLA. Learn more about Philip, his other projects, and his experience at the NASA Jet Propulsion Laboratory, on his portfolio website.

T-5, 4, 3, 2, 1. Fire!
The bright flame and roar of our rocket, Phoenix, as it goes supersonic are a sight and sound to behold. My teammates and I on the Project Ares launch crew listen intently as the sonic boom dies out and is replaced by the callouts from our avionics (aviation electronics) team, who had positioned themselves out in the mountains so they had a clear line of sight with the rocket’s communications system. They read out the nose cone avionics system altitude readings: 2,000 feet. 7,000 feet. 14,000 feet. 20,000 feet. 22,000 feet. The bunker goes silent before erupting with cheers and cries of joy.
On March 18, I was part of a team that broke the collegiate world record for highest liquid rocket altitude and also won the Dollar Per Foot Challenge, a competition hosted by the Friends of Amateur Rocketry. The organization rewards teams with a dollar for every foot of altitude, for the purposes of rocketry education.
My teammates and I are all members of Rocket Project at UCLA, a student engineering team that teaches rocket engineering through hands-on exposure to the complete design-build-test cycle. It gives students an opportunity to apply classroom subjects to a project with real-world challenges and thrilling results. Specifically, we are part of Project Ares, the club’s flagship liquid bi-propellant rocket team. The goal of the project is to cultivate experienced rocket engineers through the design, build, and test of a liquid bi-propellant rocket.
As the Project Ares electronics subteam lead, I was a first-hand witness to the special, record-breaking moment — and the stressful situations that occurred in the control bunker right before that. (I’ll explain more below.) It was quite surreal to see a product that I have worked on for nearly two years in all successfully come to fruition in a blaze of glory.
Getting to the point where we can achieve a successful launch requires countless hours in the lab. One tool our team relies on heavily is Grafana. With our dashboards, we can quickly visualize data and monitor potential hardware issues during critical phases of testing and launch.
In this blog post, I’m going to share what happens in our typical development cycle and explain how we use Grafana to develop, test, and launch record-setting rockets.

Rocketry basics
What sets our project team apart from many other university rocketry teams is that we work with liquid propellant rockets instead of solid fuel rockets.
While solid rocket motors can produce high thrust and are simpler to implement, they cannot be controlled once they are ignited and must burn until the fuel runs out. On the other hand, liquid propellant rockets can be fine-tuned and controlled during the entire launch process — at the cost of increased complexity. This benefit tends to outweigh the detriments for major systems, and make liquid rockets the standard for all major aerospace endeavors (such as SpaceX’s Falcon 9), giving members of our team industry-applicable skills.

The testing stage
Before our team is ready to launch, we begin testing, which comes in two phases: cold flows and hot fires. We rely on numerous sensors to make sure our systems are working properly, but two of the most important ones are pressure transducers and thermocouples.
Pressure transducers convert pressure into an electrical signal represented as a changing voltage. Thermocouples essentially do the same thing, but with a temperature-dependent voltage. The combination of pressure transducers and thermocouples allows us to get pressure and temperature data from our liquid oxygen and fuel tanks to make sure our system is performing nominally.
Our software stack for this year includes Flask, Telegraf, InfluxDB, and Grafana. Here is an overview of the entire ground systems architecture:

The first phase of our testing, cold flows, is done on campus and involves pressuring our system and allowing liquid nitrogen to flow through our plumbing to make sure there are no leaks and anomalies. We use Grafana here not only to observe the pressure and temperature of our liquid oxygen and fuel tanks, but also to make sure that our valves are properly actuating.
Having a timeline in Grafana that displays when the relays actuate also allows us to make sure we are properly cycling through the correct order of switches. Additionally, the quick visualization of data helps us calibrate our sensors to properly convert the raw voltages into useful metrics.
The second phase of our testing, hot fires, is performed at a test site in the Mojave Desert. It is very similar to the aforementioned cold flows, but with one key difference: We also read in load cell data.
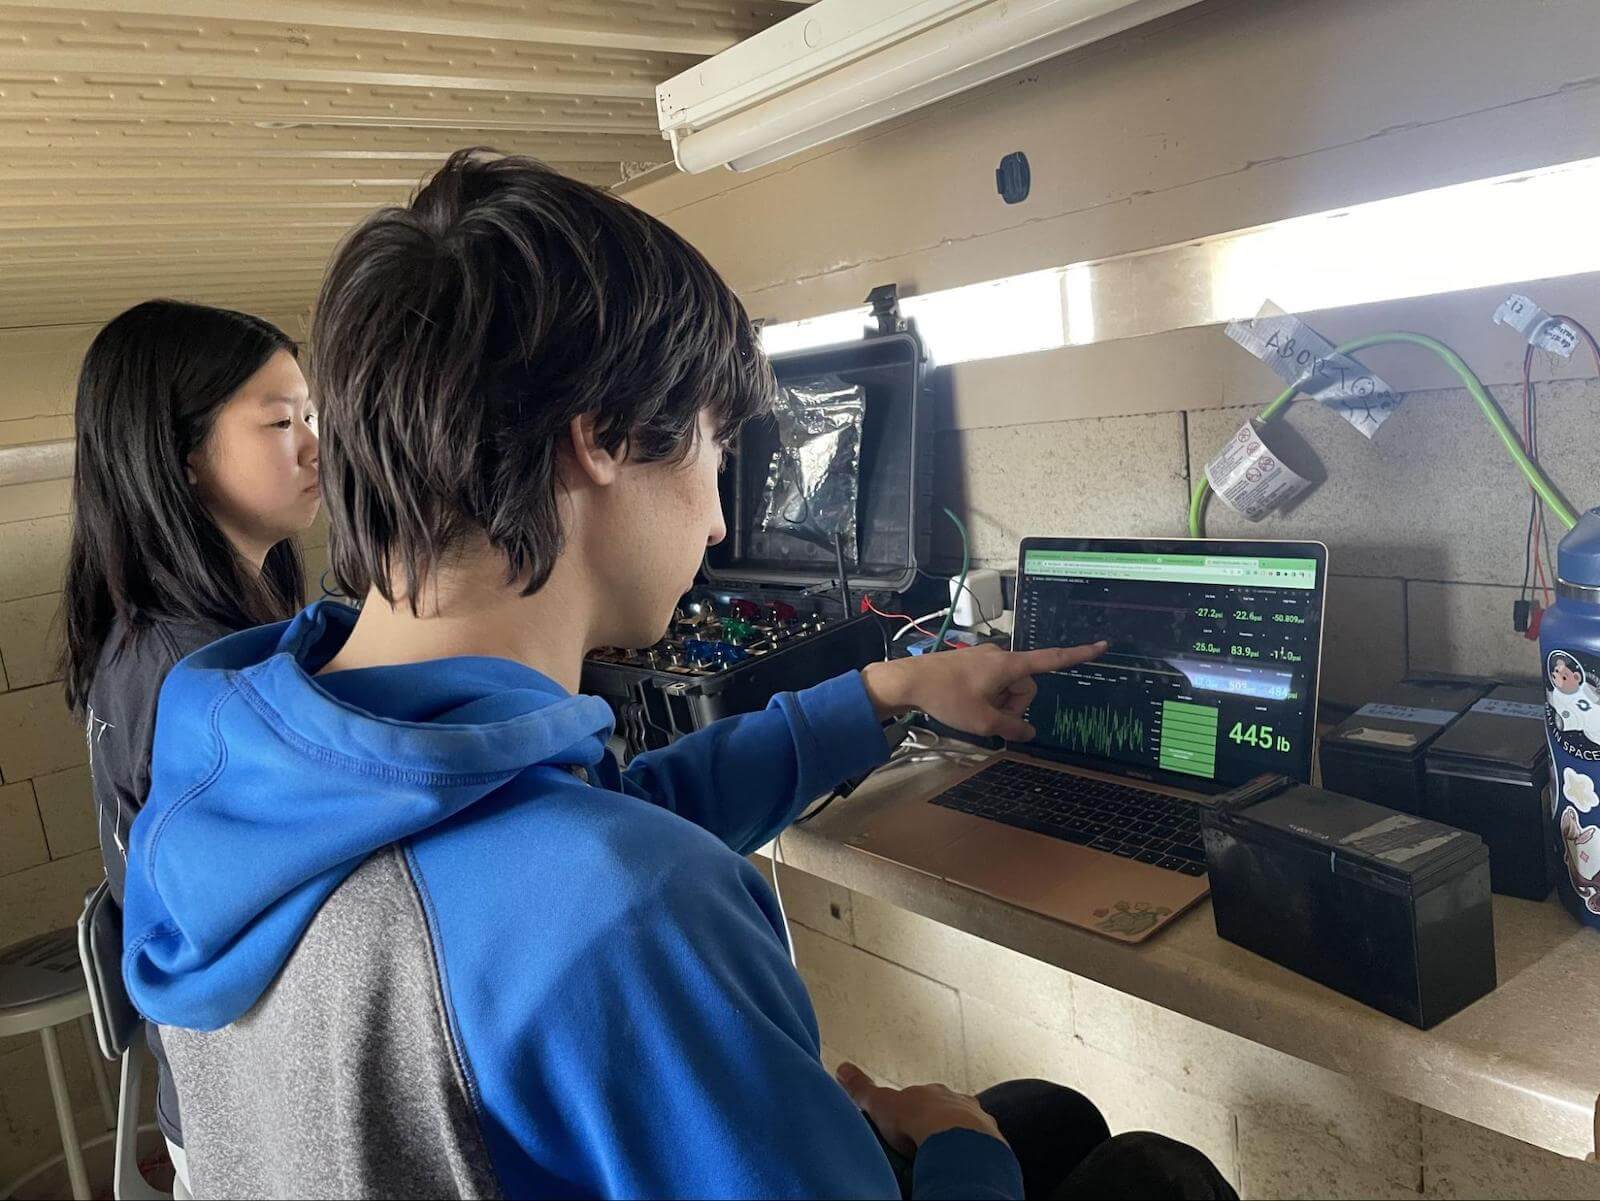
The load cell data that is also displayed on our Grafana dashboard is used to generate a thrust curve that we can use to verify that our system is able to reach our targeted apogee.
The launch stage
Once our rocketry system has passed all of our required tests, it’s time to get ready to launch.

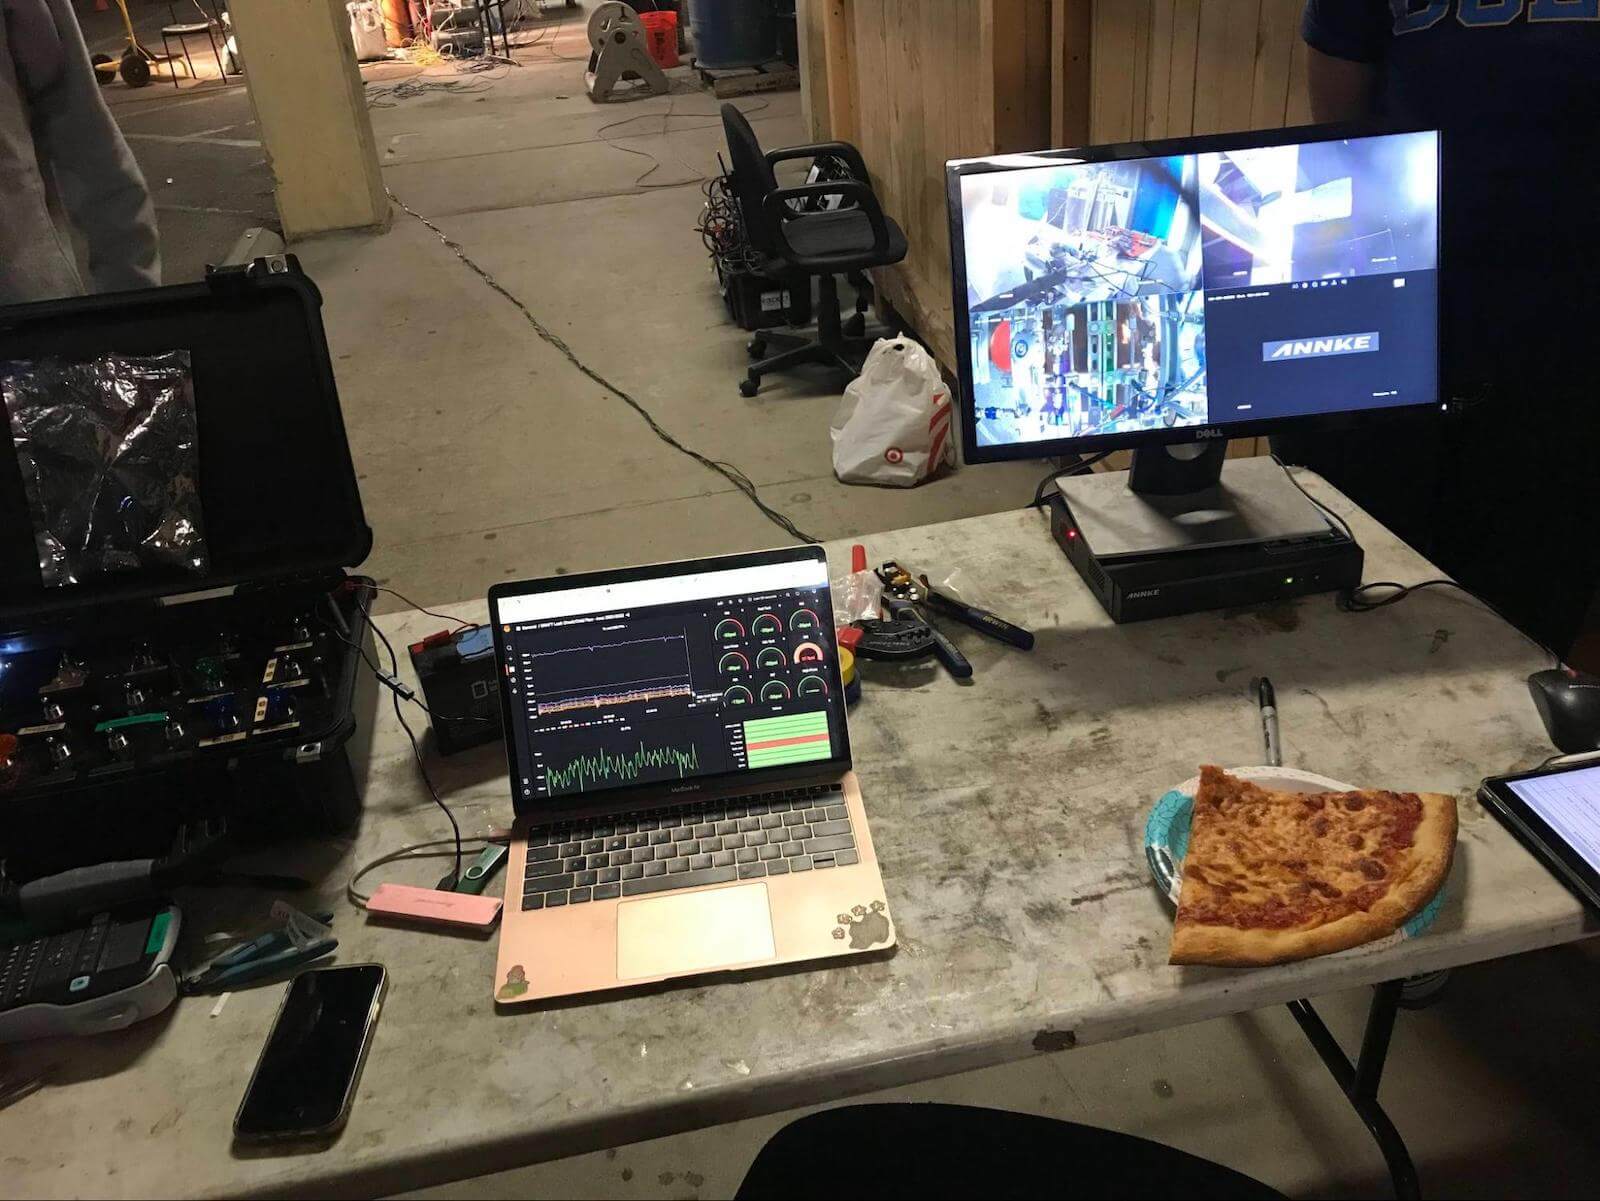
Part of our preparation includes bringing all our components to the Mojave and performing leak checks and actuation checks using the Grafana dashboard below. It shows all of the pressures, temperatures, and valve switch states I’ve previously mentioned.

Having a dashboard like this on hand means we can view live data from the tanks and quickly notice issues and fix them on the fly — which is exactly what happened right before the record-breaking launch.
Thankfully, the team monitoring the rocket in the bunker noticed that a relay was not properly actuating.

The Big Event
Once those final checks are completed, the time to launch is imminent.
On launch day at 4:59pm, there was tension in the air — and only one minute left on the clock before the FAA disallows launches. As the ignitor went off, we watched a year of hard work shriek through the sky and clouds.
Here is a look at the sensor and valve data in our launch dashboard:

Once the rocket successfully launched and started descending from its apogee, we scanned the sky, anxiously awaiting the sight of a deployed drogue and parachute.
“There it is!” someone shouted as our heads turned, and we gazed upward at the slowly descending object.
Touchdown marked the first time that our team was able to successfully recover a rocket entirely intact, a key component of the competition. A sigh of relief and sense of pride was ignited as we hiked towards the landing site, thrilled with what we had accomplished.

Future plans
Looking ahead, we hope to develop a new dashboard for live avionics data that monitors key metrics like altitude and position for the next launch cycle.
In the meantime, the entire UCLA Project Ares team would like to thank Grafana Labs for being a major part of making this passion project possible, and we look forward to our continued partnership.
Want to share your Grafana story and dashboards with the community? Drop us a note at stories@grafana.com.

