Observability overload: Insights into the rise of tools, data sources, and environments in use today
With countless observability tools, data sources, and environments to juggle, the organizations that deploy and manage today’s distributed applications often face an uphill battle to gain visibility into their application performance.
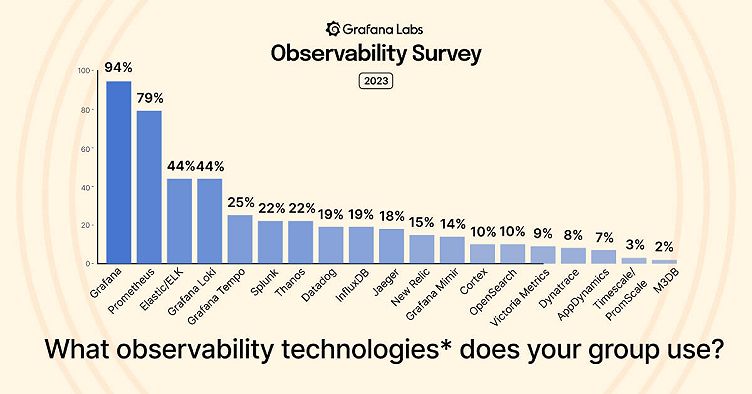
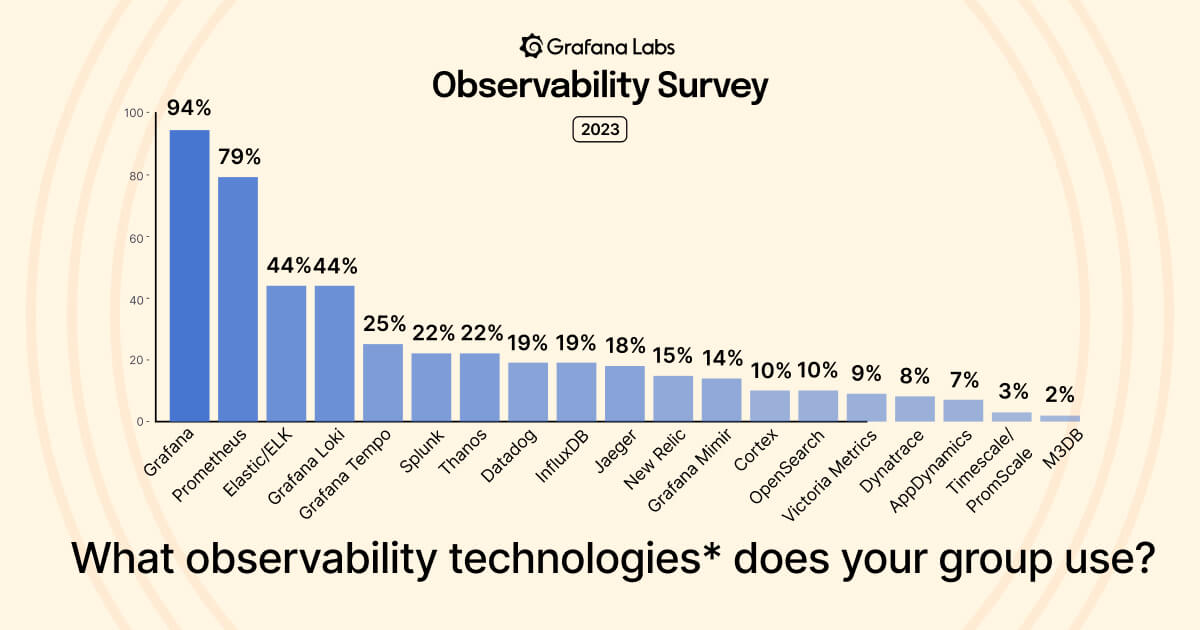
That was a key takeaway from the Grafana Labs Observability Survey 2023, which incorporated input from more than 250 industry practitioners who are all too familiar with these complexities. For example, the majority of Grafana users pull in data from at least four sources, while two-thirds of respondents said they use at least four observability tools in their group.
In this blog, we’ll take a closer look at some of the findings related to tool and data overload and provide an overview of where the observability industry is today. We’ll also dive into how some companies are successfully responding to tool sprawl by centralizing their observability efforts.
The connection between observability tools and data sources
Within our Observability Survey, 68% of active Grafana users have at least four data sources configured in Grafana. That shouldn’t come as a surprise since organizations that follow observability best practices rely on what are known as the the three pillars of observability — metrics, logs, and traces — to track the state of their applications. (Here at Grafana Labs, we also believe that continuous profiling is the emerging fourth pillar of observability.)
This telemetry data is tethered to different aspects of applications and infrastructure, and teams often require different tooling to capture the data. At a certain level, there’s baseline parity between the number of tools and the number of data sources that are deployed within a group. In our survey, 66% of respondents said they use four or more observability tools, and 68% of Grafana users have configured four or more data sources.
However, the relationship between the number of tools and the number of data sources changes as systems become more complex, especially for organizations that use a large number of disparate data and tooling. Among Grafana users, 28% have 10 or more data sources, while only 7% of respondents have 10 or more observability tools in their group.
These numbers indicate that even as the data sources increase, the number of tools to manage all that information doesn’t necessarily follow suit. This suggests that, at a certain point, a more centralized approach to observability is adopted and preferred. For example, among the Grafana users who are pulling in data from 10-plus sources, 77% have adopted centralized observability (compared to 70% overall), 98% of which have saved time or money as a result (compared to 83% overall).
‘Can’t count that high’: How many observability tools are too many?
The web of data and technologies got more complicated when we asked practitioners about observability tools in use across their entire company. In total, 41% said their companies use between six and 15 technologies, but it’s the outliers that really stand out:
- 5% use between 16 and 30 tools
- 2% use between 31 and 75 tools
- 1% said they use more than 76 tools
In fact, 2% opted for irreverence — or perhaps resignation — and selected “can’t count that high” from the survey choices.
The numbers also shift when you factor in aspects like industry or company size. For example, a much higher number of respondents in finance (31%) and government (27%) use 10-plus observability tools compared to the total percentage of respondents using that many tools (7%).
Conversely, while 34% of respondents overall said they use between one and three tools, that number jumps up for those in healthcare (44%) and energy and utilities (40%).
Company size also plays a factor — 41% of companies with more than 1,000 employees pull in 10-plus data sources, compared to just 7% among companies with 100 employees or fewer.
Cloud vs. on-prem: The impact of environments on observability
Cloud computing gave rise to things like microservices and container-based architectures that add to the complexity we’ve addressed in this post. But the ubiquity of cloud platforms like AWS, Microsoft Azure, and Google Cloud add another wrinkle for admins and SREs: Not all workloads exist in the same place anymore.
A third of respondents said they use observability in at least two environments — either managed cloud, self-managed cloud infrastructure, or self-managed on-premises — and 9% said they’re deploying across all three. This only adds to the data tooling and sources companies need, because what might have worked in your own data center won’t necessarily fit with a cloud platform, and what one cloud provider offers natively probably won’t work anywhere else.
Even the two-thirds who have focused their observability efforts on a single environment can’t agree on which environment to observe — 42% use cloud infrastructure, 36% are on-premises, and 22% rely on managed cloud environments.
Our ‘big tent’ philosophy
Traditional monitoring tools and techniques aren’t designed for this level of complexity, which is why observability has become a priority for many companies, regardless of size or industry. It’s also why more companies are centralizing their observability to get a holistic view of their workloads. Overall, 70% of survey respondents said they use a centralized approach to observability, while 83% of that group had saved time or money as a result.
While one respondent from a software and technology company cited that MTTR improved by 80% within six months of centralizing their observability efforts, another from a financial services organization said, “Centralized observability saves other teams from having to build their own monitoring infrastructure.”
Here at Grafana Labs, we subscribe to our “big tent” philosophy, which allows us to meet our users wherever they are, no matter how many tools or data sources they need, to get them the level of observability they want. “With Grafana’s ‘big tent,’ disparate data sources, from different software providers, in different industries, built for completely different use cases, can come together in a composable observability platform,” Grafana Labs CTO Tom Wilkie, recently wrote. “We believe that organizations should own their own observability strategy, choose their own tools, and have the freedom to bring all their data together in one view. Grafana makes this possible.”

