How to get started with monitoring Apache Cassandra with Grafana Cloud
Apache Cassandra is a highly scalable, open source NoSQL database system designed to handle large amounts of data across multiple commodity servers with no single point of failure.
Apache Cassandra can be run as a single node but starts making sense when it’s run in a cluster setup. The system is optimized for high write throughput and is known for its ability to handle big data workloads with ease at super-low latencies.
Apache Cassandra clusters are often used in critical, high-volume applications. Therefore, monitoring their availability and performance is non-negotiable. A poor-performing or unavailable cluster can result in lost revenue, damage to brand reputation, and potentially even legal or regulatory consequences. By monitoring a cluster’s performance and availability, operators can identify and resolve issues before they impact business operations.
To make that easier, we are pleased to announce that Grafana Cloud now offers an Apache Cassandra integration, which includes a set of prebuilt Grafana dashboards, alerts that help track latency and compaction in your database, and more.
Let’s walk through how to easily set up a Grafana Cloud account and start monitoring your Apache Cassandra cluster!
Configure the Apache Cassandra integration in Grafana Cloud
The Apache Cassandra integration utilizes metrics generated by the open source jmx_exporter project, a collector that can scrape and expose mBeans of a JMX target. You will need to set this up on all nodes in your cluster, but no need to worry — we will walk you through the steps needed in the Grafana Cloud UI. For this integration, we are using a cassandra.yaml configuration file that is based off of the example configuration for Apache Cassandra.
You can start monitoring your Apache Cassandra deployment with Grafana Cloud by following these simple steps:
- A Grafana Cloud account is required to use the Apache Cassandra integration. If you don’t have a Grafana Cloud account, you can sign up for a free account today.
- In your Grafana instance on Grafana Cloud, use the left-hand navigation to find the Connections Console (Home > Connections > Connect data).
- Install the Apache Cassandra Infrastructure Integration and configure the Grafana Agent to collect logs and metrics from it. Please refer to the how to install and manage integrations documentation for more information. For details around configuring Grafana Agent for this integration, refer to our documentation for the Apache Cassandra integration.
Start monitoring Apache Cassandra with Grafana
After the integration is installed, you will see three prebuilt dashboards for Apache Cassandra and a set of related alerts automatically installed into your Grafana Cloud account.
Apache Cassandra overview dashboard
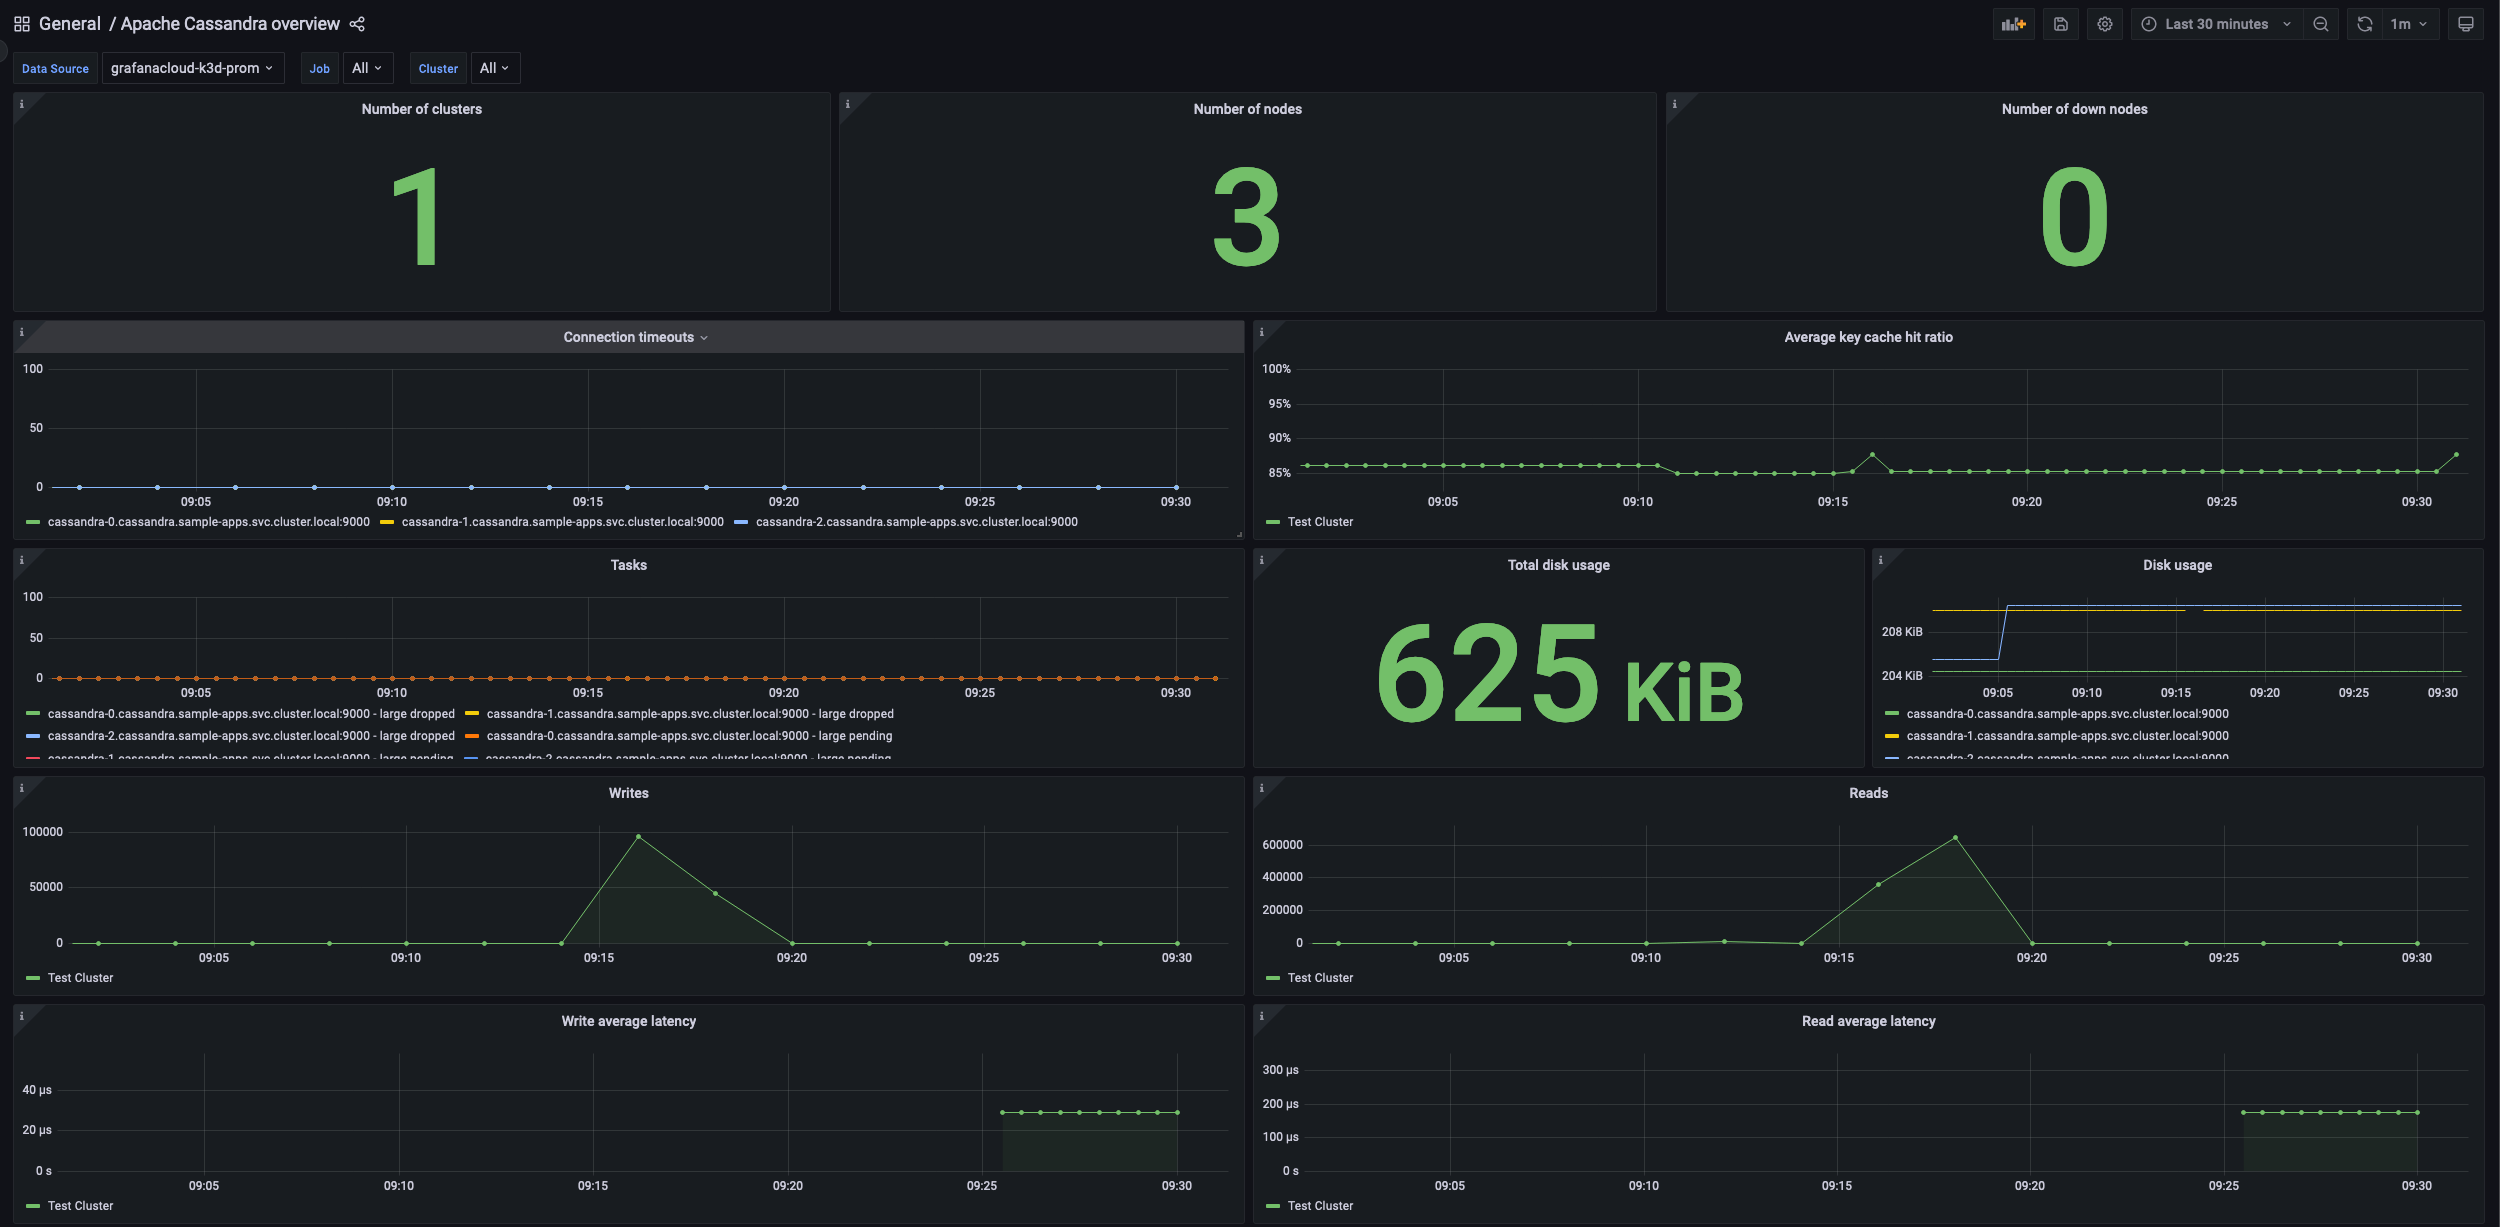
This Grafana dashboard gives a general overview of the Apache Cassandra instance based on all the metrics exposed by the embedded Prometheus exporter.

The key metrics monitored are the following:
- jvm_memory_usage_used_bytes
- cassandra_messaging_crossnodelatency_seconds
- cassandra_cache_hitrate
- cassandra_clientrequest_latency_seconds_count
The overview dashboard can provide a look into one or all of your Apache Cassandra clusters. You can also see how many clusters and nodes you are monitoring as well as the number of unavailable nodes.
In addition to multiple panels that allow you to dig deeper into read and write latencies, you can also see the average key cache hit ratio, which indicates how frequently the system is able to retrieve data from its in-memory cache instead of performing disk reads. A high hit ratio indicates efficient use of system resources and can lead to improved performance. A low hit ratio, however, may indicate the need for tuning or additional resources to improve performance.
Apache Cassandra nodes dashboard
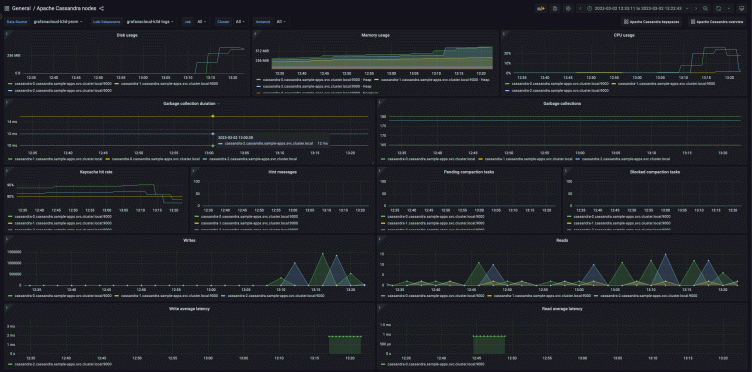
The nodes dashboard lets you dig deep into specific Apache Cassandra nodes, by highlighting the most important metrics on a node level at a glance. For example, the first row shows you the usage of disk, CPU, and memory of your nodes.


The dashboard also provides data on garbage collection. This is important to keep an eye on because Apache Cassandra is a Java-based application, and Java uses a garbage collector to manage memory. The garbage collector periodically frees memory that is no longer in use by the application, which can lead to long pause times that can affect query response times. By properly configuring and monitoring garbage collection, users can identify and tune the garbage collector to reduce pause times and improve overall system performance.
Apache Cassandra keyspace dashboard
The Apache Cassandra integration for Grafana Cloud also helps you to monitor your keyspaces. In Apache Cassandra, a keyspace can be thought of as a database in a traditional relational database system. This prebuilt Grafana dashboard allows you to see the number of keyspaces you have in a cluster and how much of the total disk space they occupy.
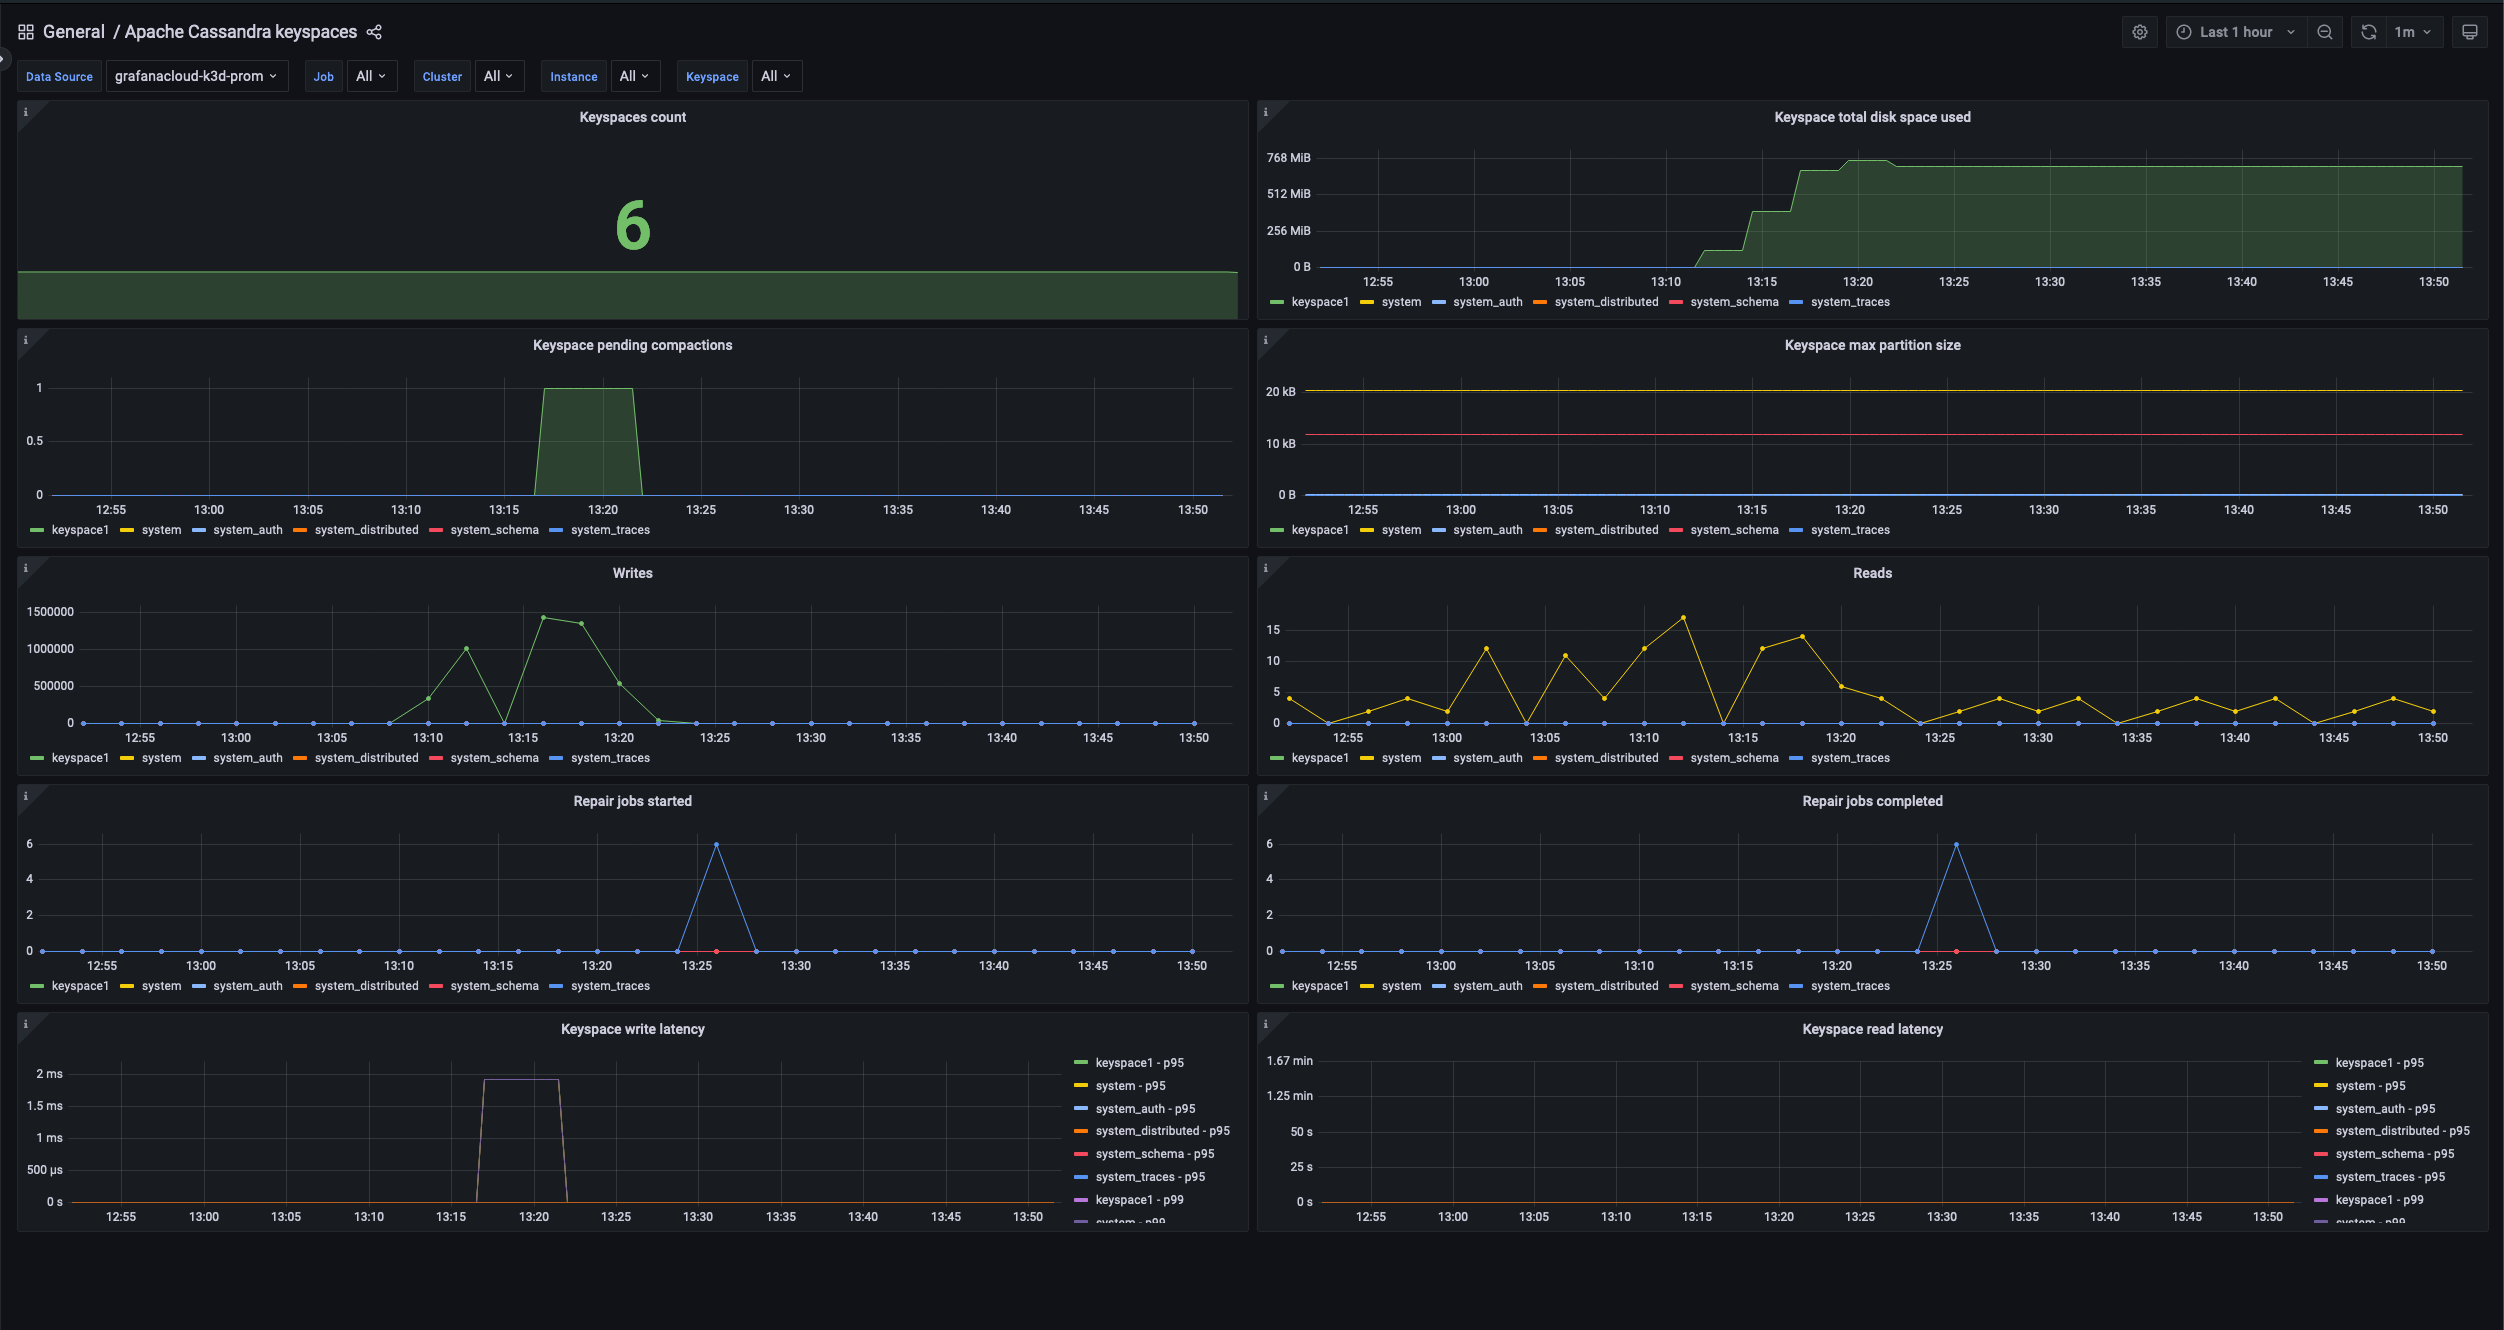
The dashboard also helps you monitor the repair jobs that are running on the cluster.
Repairs are a critical maintenance operation in Apache Cassandra. Repairs are used to synchronize data between nodes and ensure data consistency. In other words, they are essential for preventing data loss or corruption. If repairs are not run regularly or are not completed successfully, it can lead to inconsistencies in the data and potentially even data loss.
Monitoring repair jobs can help identify any issues or failures within the repair process, such as nodes being offline or network connectivity issues.
Apache Cassandra alerts in Grafana Cloud
The integration also comes packaged with a number of handy alerts.
Below is a sampling of the included alerts. Note: All the thresholds listed for each alert are set as defaults in the integration and can be configured to meet the needs of your environment.
HighReadLatency
This alert monitors the metric cassandra_table_readlatency_seconds_sum and alerts if the latency of a node is over 200ms for 5 minutes. Cassandra is used when one needs really fast reads and even faster writes. Therefore, it is super important to identify slow performing nodes quickly.
HighWriteLatency
This alert monitors the metric cassandra_table_writelatency_seconds_sum and alerts if the latency of a node is over 200ms for 5 minutes.
HighPendingCompactionTasks
The alert monitors the metric cassandra_compaction_pendingtasks and alerts you when the compaction task queue is filling up (more than 30 tasks for 15 minutes).
Compaction in Apache Cassandra is a resource-intensive operation that can impact the overall performance of the system. Compaction merges multiple SSTables (immutable data files) into a single file, which helps to reduce storage space and improve read performance. However, if compaction tasks are not completed in a timely manner, they can cause pending tasks to accumulate and potentially impact query response times and overall system performance.
Alerting on long-pending compaction tasks can help administrators identify potential issues with the compaction process, such as insufficient disk space, insufficient memory, or misconfigured compaction settings.
Learn more about the Apache Casandra integration in Grafana Cloud
The dashboards, metrics, and alerts packaged in the new Apache Cassandra integration in Grafana Cloud can help you get your Apache Cassandra monitoring up and running instantly.
Give our Apache Cassandra integration a try, and let us know what you think! You can reach out to us in our Grafana Labs Community Slack in the #Integrations channel.
Grafana Cloud is the easiest way to get started with metrics, logs, traces, and dashboards. We have a generous forever-free tier and plans for every use case. Sign up for free now!


