
Scrape Azure metrics and monitor AKS using Grafana Agent
As more organizations adopt cloud-based services like Microsoft Azure Kubernetes Service (AKS), it becomes increasingly important to monitor and manage the performance and reliability of these services. If you’re using AKS today, then Grafana Cloud provides the flexibility, performance, and visualizations you need to monitor your distributed applications.
In this blog post, we will demonstrate how to configure Grafana Agent to scrape metrics from Microsoft Azure, specifically from AKS, using the newly released azure_exporter. In addition, we’ll delve into the advantages of using this approach, and we’ll show you how to easily visualize those metrics in Grafana Cloud.
Why you should use Grafana Agent to collect Azure metrics
Let’s first explore the advantages of configuring Grafana Agent to collect metrics from Azure, and why storing them in Grafana Cloud Metrics may be a more suitable option than using the Grafana plugin for Azure Monitor.
Here are the three main benefits of scraping metrics from Azure and storing them in Grafana Cloud Metrics:
- Flexibility. Grafana provides a flexible platform for visualizing and analyzing data from various data sources. By using the azure_exporter, you can scrape metrics from Azure and store them in Grafana Cloud Metrics for easy analysis and visualization.
- Improved performance. Grafana Cloud Metrics is designed for high performance and reliability. It offers a scalable and highly available platform for storing and querying metrics, enabling faster analysis and troubleshooting.
- Better visualization. With Grafana Cloud Metrics, you can create customized dashboards with rich visualizations to help you monitor and troubleshoot your Azure services.
Grafana Agent vs. Grafana plugin for Azure Monitor
At Grafana Labs, we have a “big tent” philosophy, which means we’ll meet users where they are. So, as we just alluded to, you can use the Azure Monitor plugin to track your AKS clusters. However, we believe using the Grafana Agent with the azure_exporter integration provides several benefits over using the Grafana plugin for Azure Monitor:
More control. With Grafana Agent, you can scrape only the metrics you’re interested in, whereas the Grafana plugin for Azure Monitor may collect more metrics than you need.
Better performance. The Grafana Agent can collect and send metrics more efficiently than the Grafana plugin for Azure Monitor.
More flexibility. The Grafana Agent works with any cloud provider or on-premises infrastructure, whereas the Grafana plugin for Azure Monitor is limited to Azure.
Better integration. The Grafana Agent can send metrics to any Prometheus-compatible data store, whereas the Grafana plugin for Azure Monitor is limited to Azure Monitor.

A Grafana dashboard displays AKS time series data scraped from Azure.

How to configure Grafana Agent to scrape metrics from Azure
Now that we’ve discussed why you should use the Grafana Agent to help monitor your AKS clusters, let’s move on to how to do it. Follow these steps to configure Grafana Agent to scrape metrics from Azure using the azure_exporter integration.
1. Download and install Grafana Agent 0.32
The first step is to download and install Grafana Agent 0.32 on your system. You can find the download link and installation instructions in the Grafana documentation.
2. Create the Azure Authentication needed for the Grafana Agent configuration
To configure Grafana Agent to scrape metrics from Azure, you need to provide values for the following properties: client ID (application ID), client secret, and tenant (directory) ID. You can obtain these values from the Azure portal.
To get the values, follow these steps:
Sign in to the Azure portal.
Create an Azure App for integration:
a. In the left-hand menu, click on Azure Active Directory.
b. Under “Manage” in the Azure Active Directory blade, select Roles and administrators.
c. In the “Roles and administrators” blade, search for “Directory Readers” in the search bar and click on the Directory Readers role.
d. In the “Directory Readers” blade, click + Add assignments at the top of the blade.
e. Search for the name of the Azure App you created earlier in the “Select” search bar, then select it from the list and click at the bottom of the blade.From the App registrations panel, select the appropriate app.
Click Certificates & secrets (If you do not have a client secret, create one.)
Under Client secrets, click New client secret. Enter a name and an expiration date and click Add. Copy and paste the value of the client secret into the open file and label the value.
3. Get the subscription ID from Microsoft Azure
To get the value, go in the Azure Portal, select Subscription, and write down the subscription ID.
4. Get the username, password, and URL for the Prometheus remote write endpoint in Grafana Cloud
Next, you need to obtain the username, password, and URL for the Prometheus remote write endpoint in Grafana Cloud. This endpoint is where Grafana Agent will send the scraped metrics. You can find these values in the Grafana Cloud Metrics settings page.
Write down the remote write endpoint and the username, and generate a new password if needed.
5. Configure Grafana Agent with the following configuration (/etc/grafana-agent.yaml)
This step is crucial in setting up a reliable and efficient monitoring system for your Azure resources.The configuration specifies the azure_exporter integration, which is enabled and set to scrape metrics every 60 seconds. The specified Azure subscription and resource type are also included, as well as a list of metrics to be scraped from the Azure service. It also includes specified resource tags and dimensions to further refine the collected data, as well as details for sending that data to a Prometheus remote write URL, using basic authentication for security.
integrations:
  azure_exporter:
    enabled: true
    scrape_interval: 60s
    subscriptions:
      - asd09j3fd-d82j-dj9a-8271-ac828ckj238fs
    resource_type: microsoft.containerservice/managedclusters
    metrics:
      - node_cpu_usage_millicores
      - node_cpu_usage_percentage
      - node_disk_usage_bytes
      - node_disk_usage_percentage
      - node_memory_rss_bytes
      - node_memory_rss_percentage
      - node_memory_working_set_bytes
      - node_memory_working_set_percentage
      - node_network_in_bytes
      - node_network_out_bytes
    included_resource_tags:
      - environment
    included_dimensions:
      - node
      - nodepool
  prometheus_remote_write:
  - basic_auth:
      password: IjoiZGM0ZGIxNzVmMTNhYzVjOThlNjI0MDI5MWEyZTYzZT
      username: u295281
    url: https://prod-10-prod.grafana.net/api/prom/push
Replace the username, password, URL and subscription ID with the values from previous steps.
6. Set the following Bash environment for the user running the Grafana Agent
export AZURE_TENANT_ID="s72kf9s7-s92j-8vk2-9fk2-8fj2gd2aj2kf2"
export AZURE_CLIENT_ID="8fk28ajf-8f2k-a82k-k40a-8ff21v72ja92l"
export AZURE_CLIENT_SECRET="t27YD9bAblsATMd9a9asd8adkkX.GcYb"
Replace the values with the ones collected from the Azure portal earlier and restart the agent.
7. Create a dashboard in Grafana Cloud to visualize the scraped metrics
Now that we have configured the Grafana Agent to scrape metrics from Azure and send them to the Prometheus remote write endpoint in Grafana Cloud, we can create a dashboard in Grafana Cloud to visualize the scraped metrics.
To create a dashboard, follow these steps:
Log in to your Grafana Cloud account and select the Explore option from the left menu.
In the Explore view, you should see a list of available data sources. Select the Prometheus data source that you configured earlier.
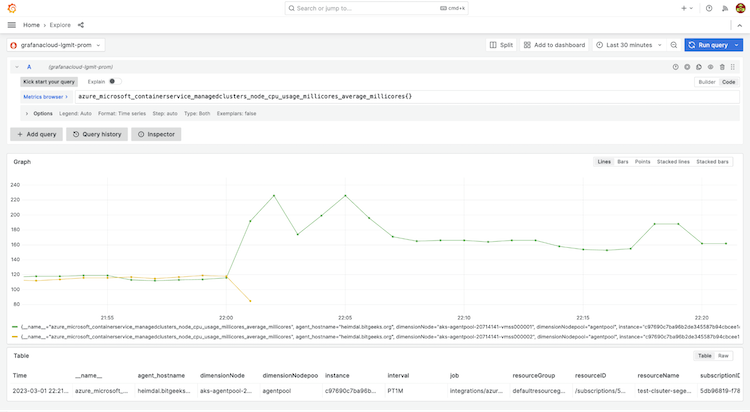
Use the query editor to build your query. For example, you could use the following query to display the average CPU usage across all nodes in your AKS cluster:
avg by (node) (azure_microsoft_containerservice_managedclusters_node_cpu_usage_millicores_average_millicores{})
This query calculates the average CPU usage in millicores across all nodes in your AKS cluster and groups the results by node.Once you have built your query, click Add to dashboard to create a new dashboard panel. You can customize the panel by selecting different visualization options, changing the panel title, and adding annotations.
Repeat these steps to create additional panels for other metrics you’re interested in.
Once you have created all of your panels, click Save to save your dashboard. You can then access your dashboard from the “Dashboards” menu in the Grafana Cloud interface.

With Grafana, you can visualize a variety of AKS-related metrics in one dashboard.

Build powerful dashboards and gain better insights
By using the Grafana Agent with the azure_exporter integration, you can collect and send metrics more efficiently, with more control and flexibility than using the Grafana plugin for Azure Monitor. This approach provides better integration with Grafana Cloud Metrics, allowing you to build powerful dashboards and gain insights into your infrastructure’s performance.
Grafana Cloud is the easiest way to get started with metrics, logs, traces, and dashboards. We have a generous free forever tier and plans for every use case. Sign up for free now!


