
How to track development metrics with VSCode Exporter, Grafana Agent, and Grafana Cloud
As a developer, I’m always thinking about ways I can make my work on projects better, faster, and more organized. Over the years, I’ve learned that tracking development metrics is a really helpful way to do that.
By keeping tabs on metrics such as the amount of time I’ve worked on specific projects and how much time I’ve spent using certain technologies, I’m able to get a better understanding of my workflow and also identify potential bottlenecks and areas where I can optimize my process. Not only that, but visualizing my development metrics in a dashboard provides me with an easy way to be transparent with employers, friends, and peers about what I’ve been working on.
In this blog post, I’m going to explain how to track metrics using the VSCode Exporter; how to display your metrics using Grafana Agent and Grafana Cloud; and how to share them in Grafana using the Public Dashboards feature.
What is VSCode Exporter?
VSCode Exporter is a powerful tool that allows you to track various development metrics directly from your Visual Studio Code (VS Code) editor. It works by analyzing your editor events and exporting the data in a Prometheus-compatible format.
With VSCode Exporter, you can track metrics such as:
- Time spent by file
- Time spent by project
- Number of lines added
- Time spent debugging
- Time spent editing
For a full list of all metrics, checkout the VSCode Exporter repository.
Setting up VSCode Exporter
To get started with VSCode Exporter, you’ll need to install the VSCode extension. You can do that by searching for “VSCode Exporter” in the Visual Studio Code Marketplace.
VSCode Exporter will automatically export your metrics to a Prometheus-compatible endpoint on port 9931 by default. The port can be changed on your VS Code settings by opening your VS Code settings and searching for “VSCode Exporter” on the UI. Once you find it, you can change the port and enable debug logging. For any new settings to take effect, you’ll need to reload your VS Code window. You can do that by using Ctrl + Shift + P if you’re using Windows or Cmd + Shift + P on a Mac, and searching for the “Reload Window” command.
Displaying metrics with Grafana Agent and Grafana Cloud
Once you have the VSCode Exporter configured, you’ll be able to use Grafana Agent to collect your metrics and export them to a Prometheus instance. With Grafana Cloud, you can then display them in a beautiful dashboard.
To get started with Grafana Agent, you’ll need to install it on the same machine as your VS Code. You can do this by following the installation instructions provided by Grafana.
After that, you’ll need to configure it to collect metrics from your Prometheus endpoint. You can do this by adding the following configuration to your Grafana Agent configuration file:
metrics:
  wal_directory: /tmp/grafana-agent-wal
  configs:
    - name: vscode
      scrape_configs:
        - job_name: vscode
          scrape_interval: 5s
          static_configs:
            - targets:
                - localhost:9931
              labels:
                instance: <Your Hostname>
                job: vscode
      remote_write:
        - basic_auth:
            password: <Your API Key>
            username: <Your Username>
          url: <Your Prometheus URL>
This configuration specifies that Grafana Agent should collect metrics from a Prometheus endpoint running at localhost:9931 and export them to a remote endpoint using HTTPS authentication. If you wish to use a different port for VSCode Exporter, you must update it in your VS Code settings and use it for this configuration.
The file above has some variables that have to be manually changed on your end. On the remote write settings, you need to configure your Grafana Cloud username, API key, and remote write endpoint. On the instance label, if you want to track time spent in different operational systems or compare data between different hardware, change the value to something that identifies the machine that is running VS Code.
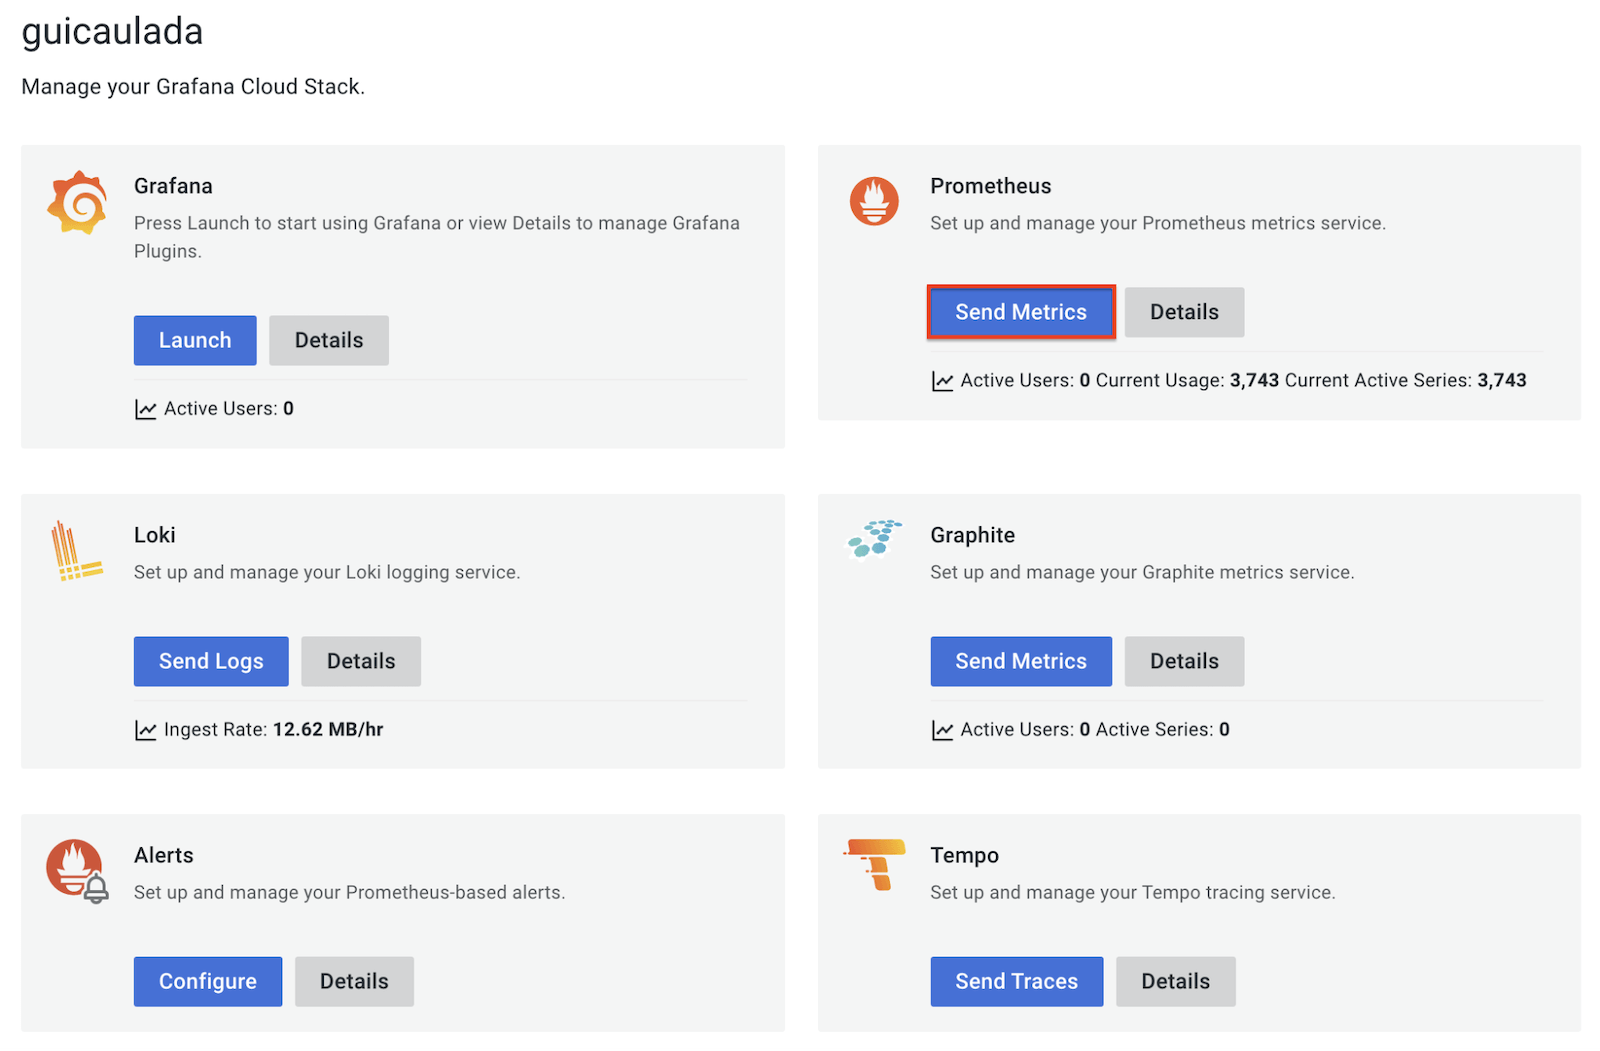
To confirm your username and URL, first navigate to the Cloud Portal, then from the Prometheus box, click Send Metrics.
Next, you’ll need to create a dashboard in Grafana Cloud to display your metrics. To do this, log in to your Grafana Cloud account and click on the Create Dashboard button. From there, you can add various panels to your dashboard to display your metrics in the way that makes the most sense for your use case. If you don’t know where to start, try the basic VSCode Exporter dashboard.
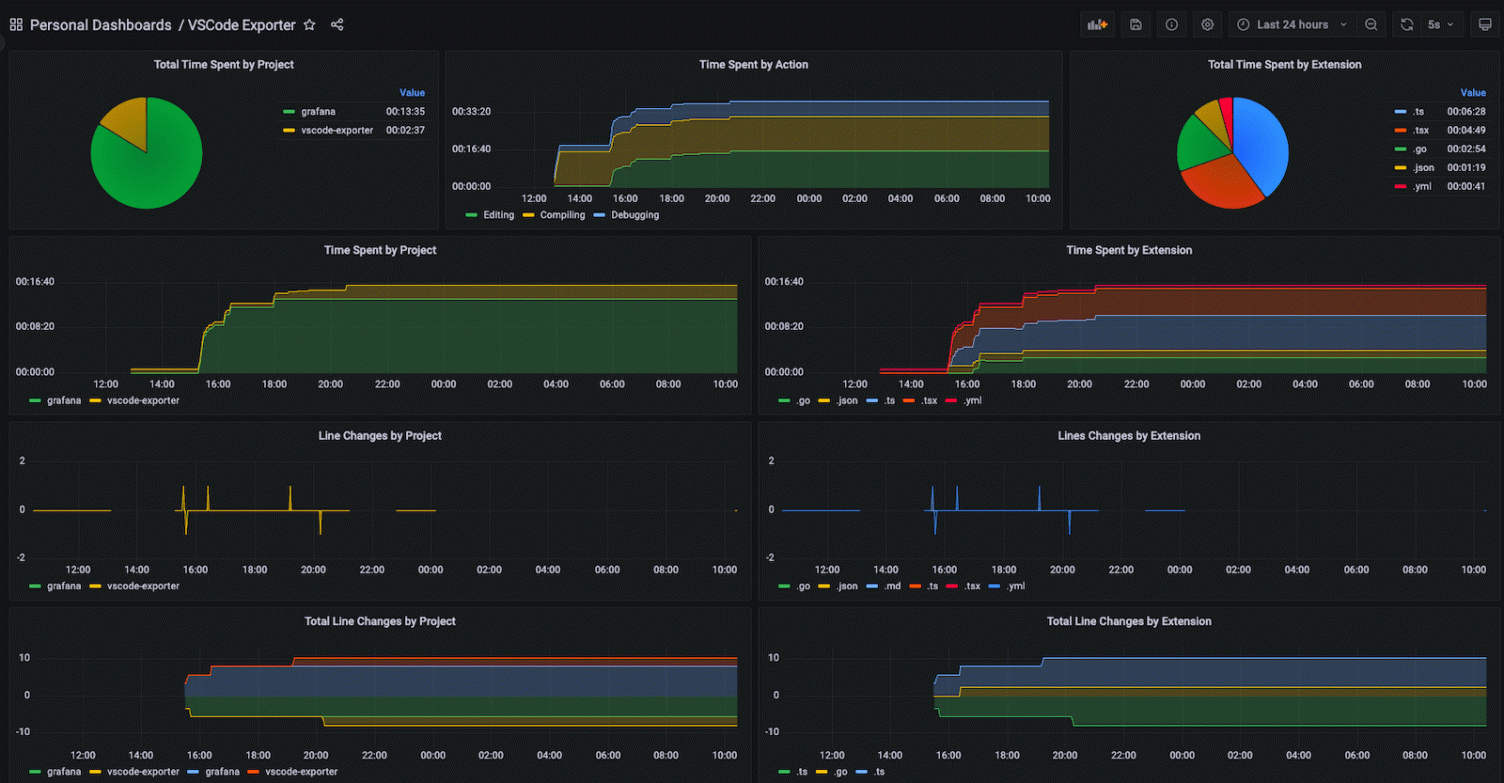
The dashboard below that I created shows me information about how much time I’ve spent working (one panel shows projects and another breaks it down by file extension), plus how much time I spent editing, debugging, or compiling. There is also data about line changes, which can be visualized by specific times of day or as a total for a selected time range.

The information in the dashboard can be used to help you track what time of the day you are more productive and identify large compile times that are impacting your productivity. It’s also a helpful way for developers in a community to share active projects and recent experiences with specific programming languages and technologies.
Sharing your dashboard
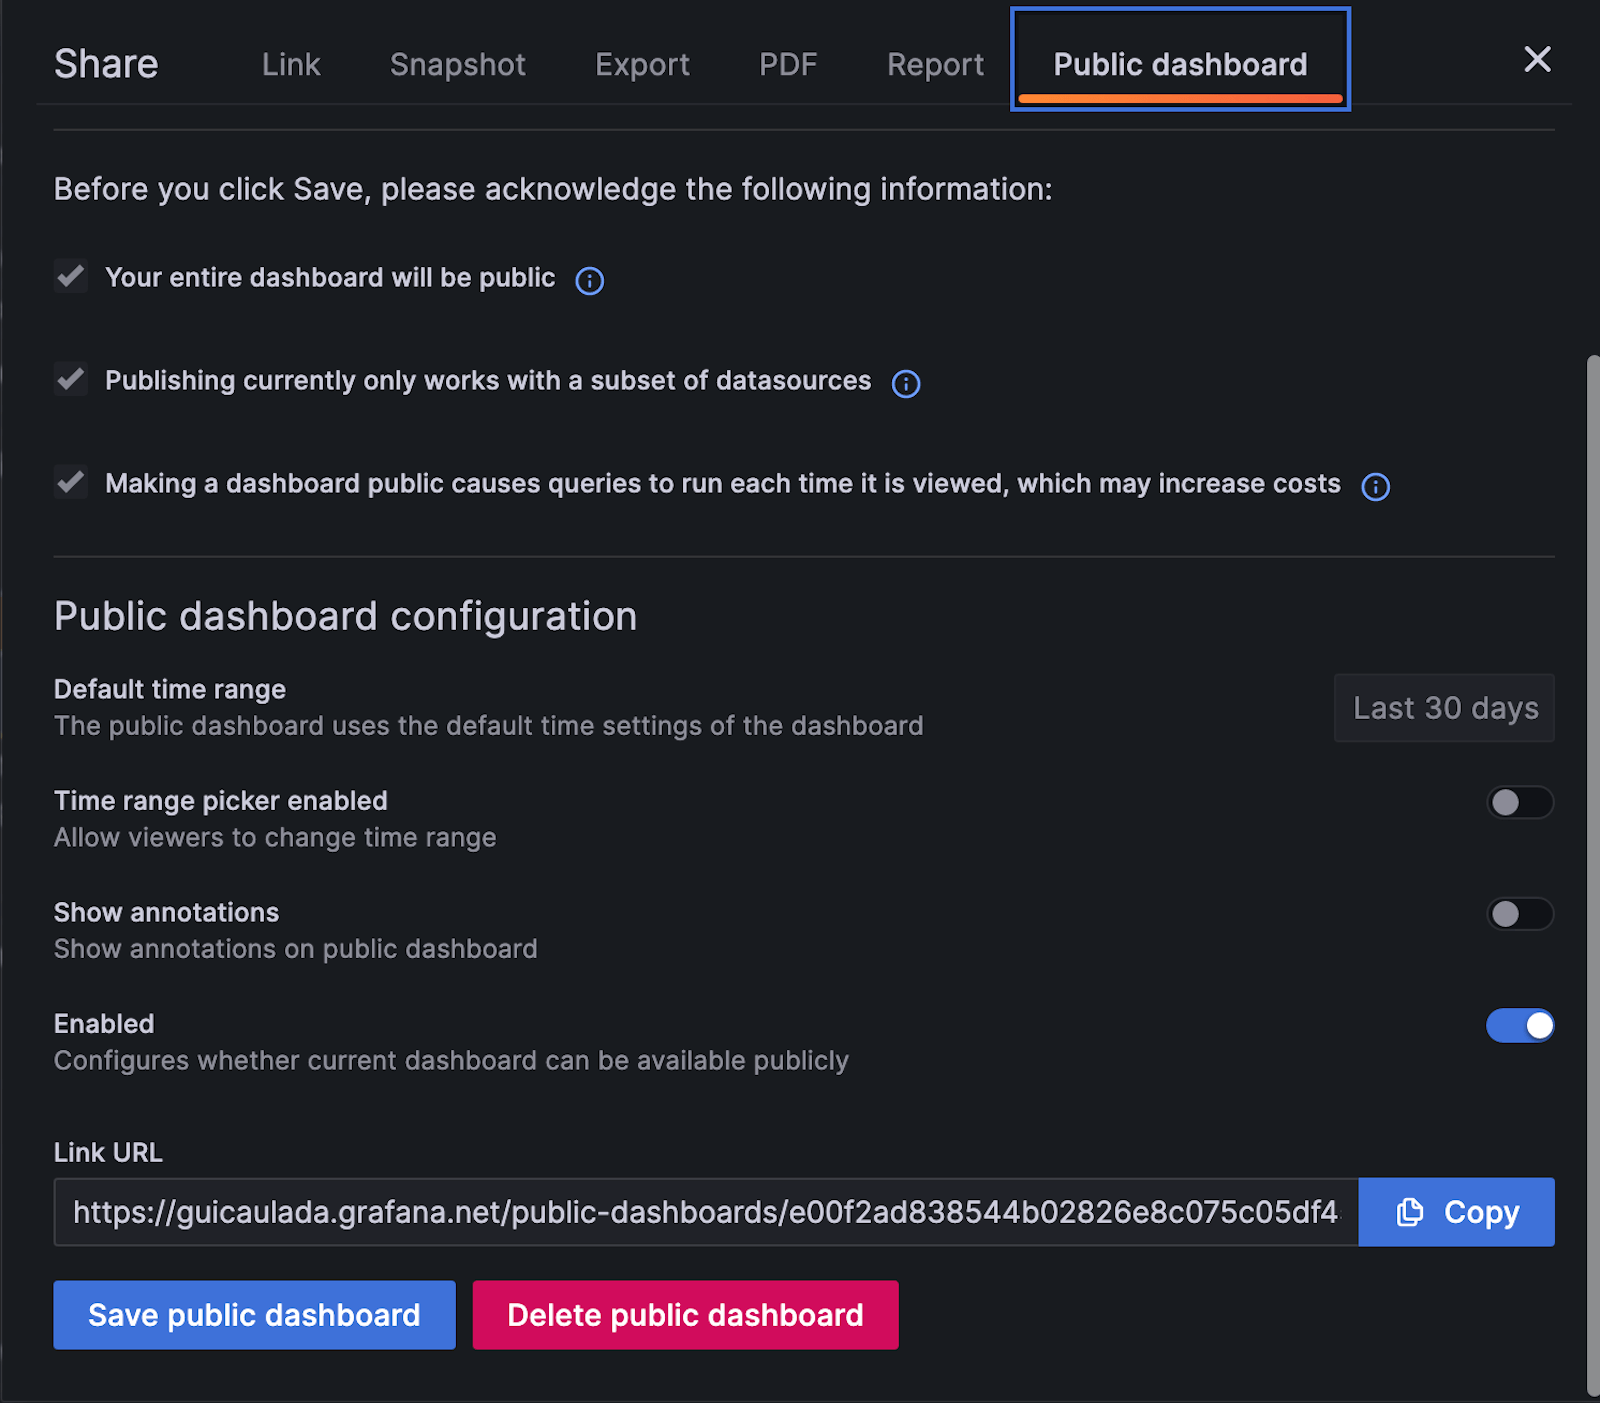
One of the great additions that came with the release of Grafana 9.1 is the Public Dashboards feature. Using it is simple: Once you’ve created a dashboard, select the Share button, choose Public dashboard, acknowledge the statements in the window, and toggle the Enabled switch.
Final thoughts
Observing my development metrics has provided valuable insights into my work and increased my productivity and efficiency. It helped me prioritize my tasks better and adjust my schedule accordingly.
I put a link to my development metrics Grafana dashboard on my GitHub profile — I think it’s a smart idea for developers. GitHub already displays contributions to different repositories in the platform, but the community appreciates the extra transparency. Also, I like that when anyone is interested in working with me, they can see my recent experiences with different programming languages and technologies, and learn more about how much active development time I’ve been putting into my projects. It’s a great addition to my portfolio because it shows I’m data-driven and transparent.
I hope you’ve found this post helpful. If you want to know more about what I’ve been working on, feel free to check out my dashboard.
Grafana Cloud is the easiest way to get started with metrics, logs, traces, and dashboards. We have a generous free forever tier and plans for every use case. Sign up for free now!


