Grafana Labs webinars: Getting started, scaling Prometheus, and of course, more plugins!
This March, we continued February’s theme of focusing on the core building blocks of the Grafana LGTM Stack (Loki for logs, Grafana for visualization, Tempo for traces, Mimir for metrics). This included webinars on how to get started with Grafana, how to integrate yet another plugin (Google Cloud Monitoring), and how to scale Prometheus metrics.
Here’s a look at the on-demand sessions you may have missed in March — and the upcoming webinars you can register for right now.
Getting started with the Grafana LGTM Stack
If you checked out our webinars in January and February on reducing both your resolution time (MTTR) and observability total cost of ownership (TCO), then it’s finally time to dive into the Grafana LGTM Stack this March.
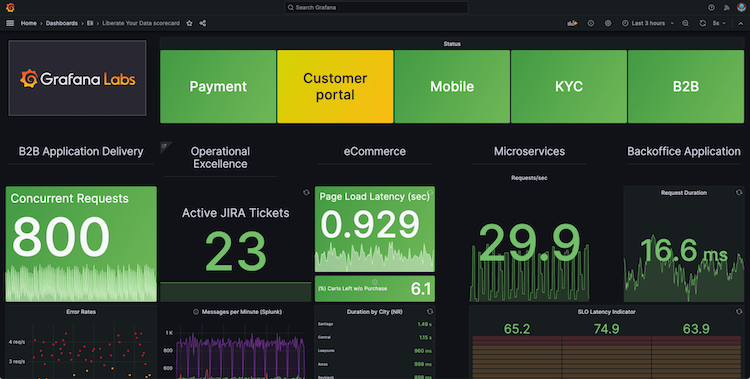
In this session, Grafana Labs Solutions Engineer Eli Bonadies walked us through the Grafana LGTM Stack and ran a couple of demos highlighting many of its features. This included how to add panels and run queries using disparate data sources to visualize everything in one dashboard for a true single-pane-of-glass view.

Scaling and securing your Prometheus metrics in Grafana
For many users, the next natural step after getting started in Grafana is to scale the data they have. In this webinar, Senior Solutions Engineer Colin Wood walked through how to scale your Prometheus metrics using Grafana Enterprise Metrics (GEM). With a focus on security and role-based access control (RBAC), Colin demonstrated how to create tenants, teams, access policies, and tokens for managing multi-tenancy.

Visualizing Google Cloud with Grafana
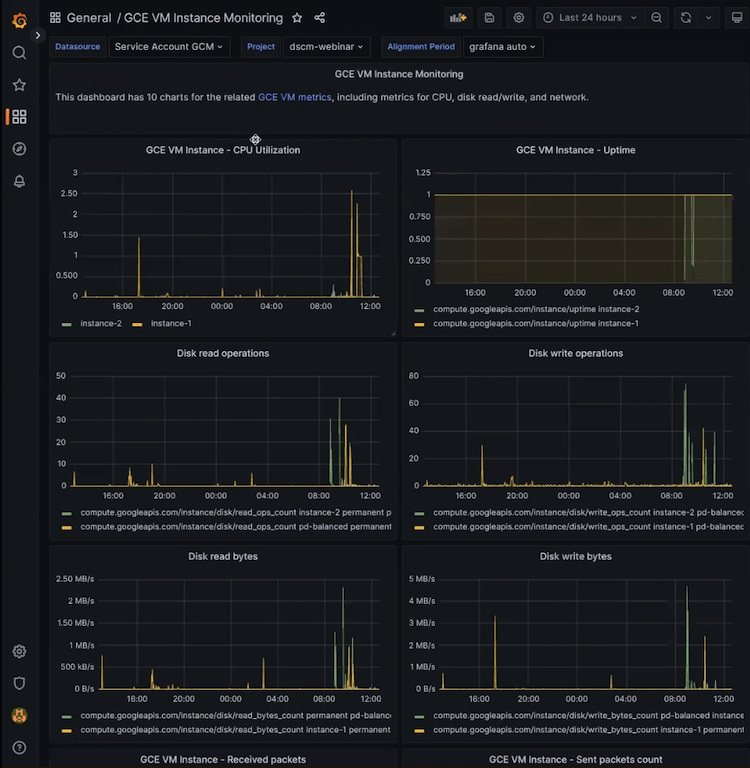
Using plugins in Grafana is a great way to connect your external data sources in order to further elevate your single-pane-of-glass view. This month, we took another deep dive into the Google Cloud Monitoring (formerly Stackdriver) OSS plugin. Software Engineer Adam Simpson dove right into a real-time demo of how to add the Google Cloud Monitoring plugin (included with Grafana Cloud) so you can easily start visualizing your Google Cloud data.

Grafana webinars: Coming soon …
This April and May, we’re focused on webinars that will help you prepare, or provide any needed refreshers ahead of GrafanaCON 2023. If you or someone you know is looking to start from the beginning, or if you want to revisit the foundations of our LGTM Stack, now is a great time to do so. Following our recent getting started webinar, which is now available on-demand, here’s what we have in store for the next two months:
Scaling your observability with the Grafana LGTM Stack
April 5 | 09:30 PDT, 12:30 EDT, 16:30 UTC and
May 11 | 10:00 CEST, 13:30 IST, 08:00 UTC
In this 30-minute demo, we’ll show you how to get started with the Grafana Enterprise Stack.Intro to metrics with Grafana: Prometheus, Grafana Mimir, Graphite, and beyond
April 11 | 10:00 PDT, 13:00 EDT, 17:00 UTC
Learn about the challenges that come with scaling metrics systems, with a particular focus on Prometheus, Grafana Mimir, and Graphite.Getting started with Grafana dashboard design
April 13 | 10:00 CEST, 13:30 IST, 08:00 UTC
Find out more about how to best determine your audience and context in order to build dashboards with purpose.Getting started with TraceQL
April 18 | 09:30 PDT, 12:30 EDT, 16:30 UTC
In this 45-minute webinar, we’ll introduce you to TraceQL, our new query language specifically designed for distributed tracing in Grafana Tempo 2.0.Unify your data with Grafana plugins: Datadog, Splunk, MongoDB, and more
April 25 | 09:30 PDT, 12:30 EDT, 16:30 UTC
Learn how to leverage our robust plugin ecosystem to visualize data and perform analytics on disparate data sources.Advanced querying with Grafana Loki
April 27 | 10:00 CEST, 13:30 IST, 08:00 UTC
Learn tips and tricks on how to use lesser known LogQL features to improve your queries.Getting started with logging and Grafana Loki
May 4 | 10:00 PDT, 13:00 EDT, 17:00 UTC
Learn what Grafana Loki is, what it does, and see a demo of the new and updated features of Loki 2.7.Getting started with tracing and Grafana Tempo
May 10 | 11:00 PDT, 14:00 EDT, 18:00 UTC and
May 25 | 10:00 CEST, 13:30 IST, 08:00 UTC
Learn what Grafana Tempo is, what it does, and see a demo of the new and updated features of Tempo 2.0.Scaling and securing your logs with Grafana Loki
May 17 | 11:00 PDT, 14:00 EDT, 18:00 UTC
Get a review of Grafana Loki, then learn about the challenges with logging as organizations scale and the volume of logs explodes, and find out how Grafana Cloud Logs and Grafana Enterprise Logs (GEL) can help.Scaling your distributed tracing with Grafana Tempo
May 24 | 11:00 PDT, 14:00 EDT, 18:00 UTC
Get a review of Grafana Tempo, then learn about Grafana Enterprise Traces (GET) and its features, such as access controls, indemnification, support guarantees, and more.
Check out our Webinars page for a full list of on-demand sessions and upcoming live webinars.
