GrafanaCON 2023: Get a first look at this year's agenda
GrafanaCON 2023 will be here before you know it, and there’s no better proof than this: The agenda is now live!
This year’s event will mark the release of Grafana 10, the latest major version of the open source project that Torkel Ödegaard started back in 2013. As we prepare to celebrate both Grafana 10 and 10 years of the Grafana project, there’s never been a better time to attend Grafana Labs’ annual community conference. And we’ve got an agenda to match all that excitement, with dozens of sessions led by Grafanistas and community members from around the world.
A closer look at the GrafanaCON 2023 agenda
The free virtual conference kicks off on June 12 with a one-day technical workshop, followed by two full days of sessions led by community members and Grafana experts, including the keynote live streamed from Stockholm, the birthplace of Grafana.
There will be deep dives on Grafana 10 features and fun IoT talks, as well as technical sessions about how Grafana is being used at organizations such as NVIDIA, DHL Express, Energy Sciences Network at Berkeley National Lab, NASA Ames Research Center, Daimler Trucks, and more. Check out the GrafanaCON site for the full agenda, or continue reading to see just some of the exciting sessions you can attend this June.
From the Grafana Labs team
Deep dive into Grafana 10
Be among the first to get an in-depth look at Grafana 10. Team members will demo all the new features, functionality, and ease-of-use improvements in this major latest release.
Homelab hacking: Grafana on an LED matrix display
Love your Grafana visualizations? Think they’d look even better on an LED matrix display? You’ve come to the right place. Check out this demo of how to build a custom Grafana panel in order to display time series data on an esp32-powered LED matrix display!
What’s new in docs: improvements, how to contribute, and more
Hear from members of the Grafana Labs technical writing team, who will dive into the world of docs, including highlights of the Writers’ Toolkit for contributing content, improvements to the docs site, updates over the past year, and future plans.
Get started with home automation with Raspberry Pi and Grafana Cloud
This session will help you take baby steps toward visualizing and monitoring the home smart devices that you may already have around the house. Find out what you can do with a Raspberry Pi, Grafana Cloud, Ring home security system, Ecobee thermostat, two smart power plugs (powering TVs), home router, HP printer, Macbook, and even a blood sugar monitor!
Creating a high-performance data culture with Grafana
So you are sitting in front of Grafana. Now what? Grafana can do much more than provide actionable insights; it can create a high-performing culture around that data, and the actionable insights it generates. Explore the softer side of Grafana: how people interact with data, the curiosity it generates, and how that can set the stage for a high-performance culture that saves millions of dollars.
From the community
Transforming IT and business flows at DHL Express with Grafana, k6, and Prometheus
At DHL Express Switzerland, a unit of the international logistics and shipping company, traditional IT and business support was cumbersome, disparate, reactive, and expensive. Learn how they transformed support issues into a massive benefit by selecting the open source Grafana observability stack and Prometheus as well as the performance testing tool Grafana k6.
How NVIDIA’s Threat Detection System uses Grafana and Loki for log analysis at scale
The security team at NVIDIA, a leading manufacturer of GPU and AI hardware and software, has developed a powerful system for analyzing security logs at scale to detect malicious activity. They rely on Grafana and Grafana Loki to provide a robust yet cost-effective platform for analyzing different types of data to identify and respond quickly to any suspicious activity.
Automated performance modeling with NASA Open MCT, Grafana Cloud, and k6
Catch a live demo that will show how NASA’s Space Mission Controls uses Grafana k6, k6-browser, and NASA Open MCT to combine frontend and backend performance modeling tools. Learn about the frontend performance modeling strategies they rely on to keep the feature development teams in sync with the performance tests.
Reducing data center energy usage with Grafana: A green IT success story
Sentry Software operates its own data center as part of its business helping companies with IT monitoring solutions. Hear from the company’s CEO on how they used Grafana and OpenTelemetry to analyze their energy footprint and help reduce their data center electricity usage by 15%.
How ESnet built Grafana plugins to visualize network data
ESnet (Energy Sciences Network) at Berkeley National Lab is a high-performance network backbone built to help scientists collaborate and perform research remotely. ESnet has open-sourced Grafana visualizations tailored to its network analytics, which it then uses to predict capacity needs. Learn how you can use them for your own purposes, networking and otherwise.
Start the celebration today, and stay tuned for more
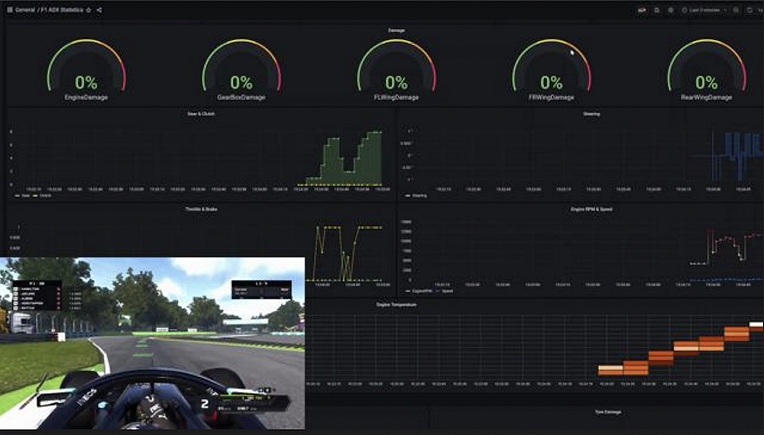
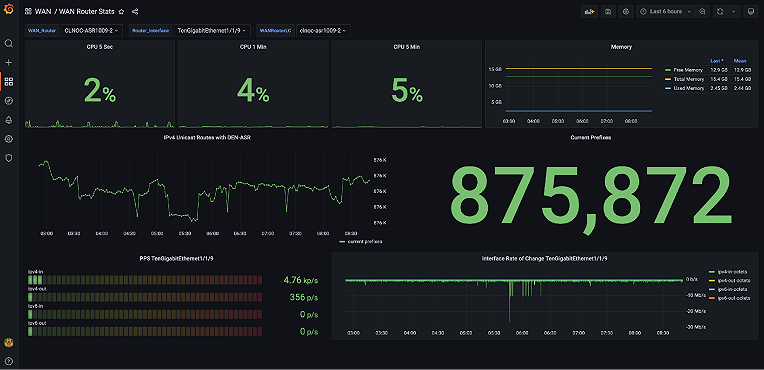
If you just can’t wait for June to arrive, you can dip your toes into the festivities today by entering the Golden Grot Awards. The awards will highlight the amazing Grafana dashboards our community has created by recognizing the best of the best. One grand prize winner in each category — personal and professional — will even be treated to a trip to Stockholm to join the Grafana creators at a special event, so get your submissions in by April 21!
The countdown has begun! Check out the full schedule, and if you haven’t already, register now for free.