
How to monitor an xDSL Modem using a Prometheus Exporter plugin and Grafana Agent on Grafana Cloud with Grafana OnCall
Furkan Türkal likes to design and implement new tech stacks with a deep focus on distributed and low-level systems. He is interested in contributing to open source projects, communities, and project management, and has a strong interest in the CNCF world! Recently, he has been doing research on Supply Chain Security.
Hardware breaks, just like our hearts — and both can be due to complicated situations. Recently, I’ve had to deal with many short-term internet outages, and it was difficult to figure out what was causing the problem: Was it my internet service provider (ISP) or simply that my old, rusty modem can’t stably manage all of my home network traffic?
Anything from lousy cable design to bad weather conditions could increase noise ratio — especially if your digital data is being transmitted over old copper telephone lines, as is the case with my xDSL.
At the company where I work, Trendyol (an e-commerce platform), we use self-managed Grafana almost every hour of every day. One morning, an idea came to me in the shower: Why not scrape the xDSL metrics on my modem so I could really be sure I knew what was going on with it?
I had never used Grafana Cloud before, but I decided this was an excellent opportunity to try it out (and it was free!). By observing the data, I could monitor the modem status more closely and I’d quickly be able to pick up on issues. One of my inspirations was the great blog post “How I monitor my OpenWrt router with Grafana Cloud and Prometheus” by Matthew Helmke.
In this post, I will tell you what happened during my 24-hour journey and how I ended up with this:
It’s dazzling, isn’t it?
Grab your coffee, open your favorite low-fi music, and settle in.
Background basics
Developing on a resource-limited device is challenging, especially in the case of low-end modems which have limited RAM, CPU, and storage. My xDSL modem is an ASUS DSL-AC51. It has a groundbreaking 60 MB of RAM, of which ~95% is actively used. Unfortunately, installing and running an application inside is almost impossible due to critical resources (which isn’t the case with OpenWRT).
Many modems nowadays — mine included — have SSH and Telnet support, so I thought, Why not take advantage of it to scrape entire metrics from the modem? I knew I could easily send commands over the protocol and parse the results in a readable format. Then if I transformed those human-readable formats to Prometheus-readable formats? Hmmm . . . sounds delicious!
Starting off
Usually when I begin a project, I Google my idea to see if anyone has done something similar, but I couldn’t find much this time. I decided what I needed to do next was understand how my modem reads my DSL statistics to print on the modem dashboard. I found one concrete result on Super User that explained how to access SNR diagnostics on a Linux based DSL modem. The author, Jono, noticed an application named “spectrum,” so I started with that.
Side note: If you’re going to follow along with this project, enable SSH on your modem home page. Also, it would be best if you created an RSA key.
- SSH into modem:
$ ssh 192.168.1.1 - Run ps command:
$ ps auxw - Notice there is a process called: “spectrum”
What I needed to understand was how the spectrum works. Which binary is it calling under the hood? How does it interact with firmware?
I found my open source asuswrt-rt firmware on GitHub, then searched for the “spectrum” keyword. I found some filenames in the frontend code placed at Main_Spectrum_Content.asp file. They were mostly prefixed with /var/tmp/spectrum-*. I ran $ ls /var/tmp but couldn’t find those files in my filesystem. Maybe they were garbage collected or I had permission issues — I don’t know. What I did know is that I was getting closer.
On the repository, there was also a script named filesystem/usr/script/check_spectrum.sh. That is simply checking if the daemon is running, and if not, it executes /userfs/bin/spectrum &.
My next move was to jump to the source ./filesystem/userfs/bin/ to find and download the “spectrum.”
I ran the $ strings ~/Downloads/spectrum command to check hard-coded strings in the binary, and I saw very precious things!
cat /proc/tc3162/adsl_showbpc_us > /var/tmp/spectrum-bpc-us
cat /proc/tc3162/adsl_showbpc_ds > /var/tmp/spectrum-bpc-ds
cat /proc/tc3162/vdsl_showbpc_us > /var/tmp/spectrum-bpc-us
cat /proc/tc3162/vdsl_showbpc_ds > /var/tmp/spectrum-bpc-ds
cat /proc/tc3162/adsl_showsnr > /var/tmp/spectrum-snr
cat /proc/tc3162/vdsl_showsnr > /var/tmp/spectrum-snr
Just wow! Spectrum was actually a simple daemon and a wrapper for $ /proc/tc3162/* commands. What is tc3162? TC3162 is TrendChip’s ADSL2/2+ SoC processor, a highly integrated solution for the ADSL broadband access gateway. At this point, I can’t wait to execute ls under /proc/tc3162 to find out what kind of gold I can extract. Here are some configurations and values that chip exposes onto the kernel:
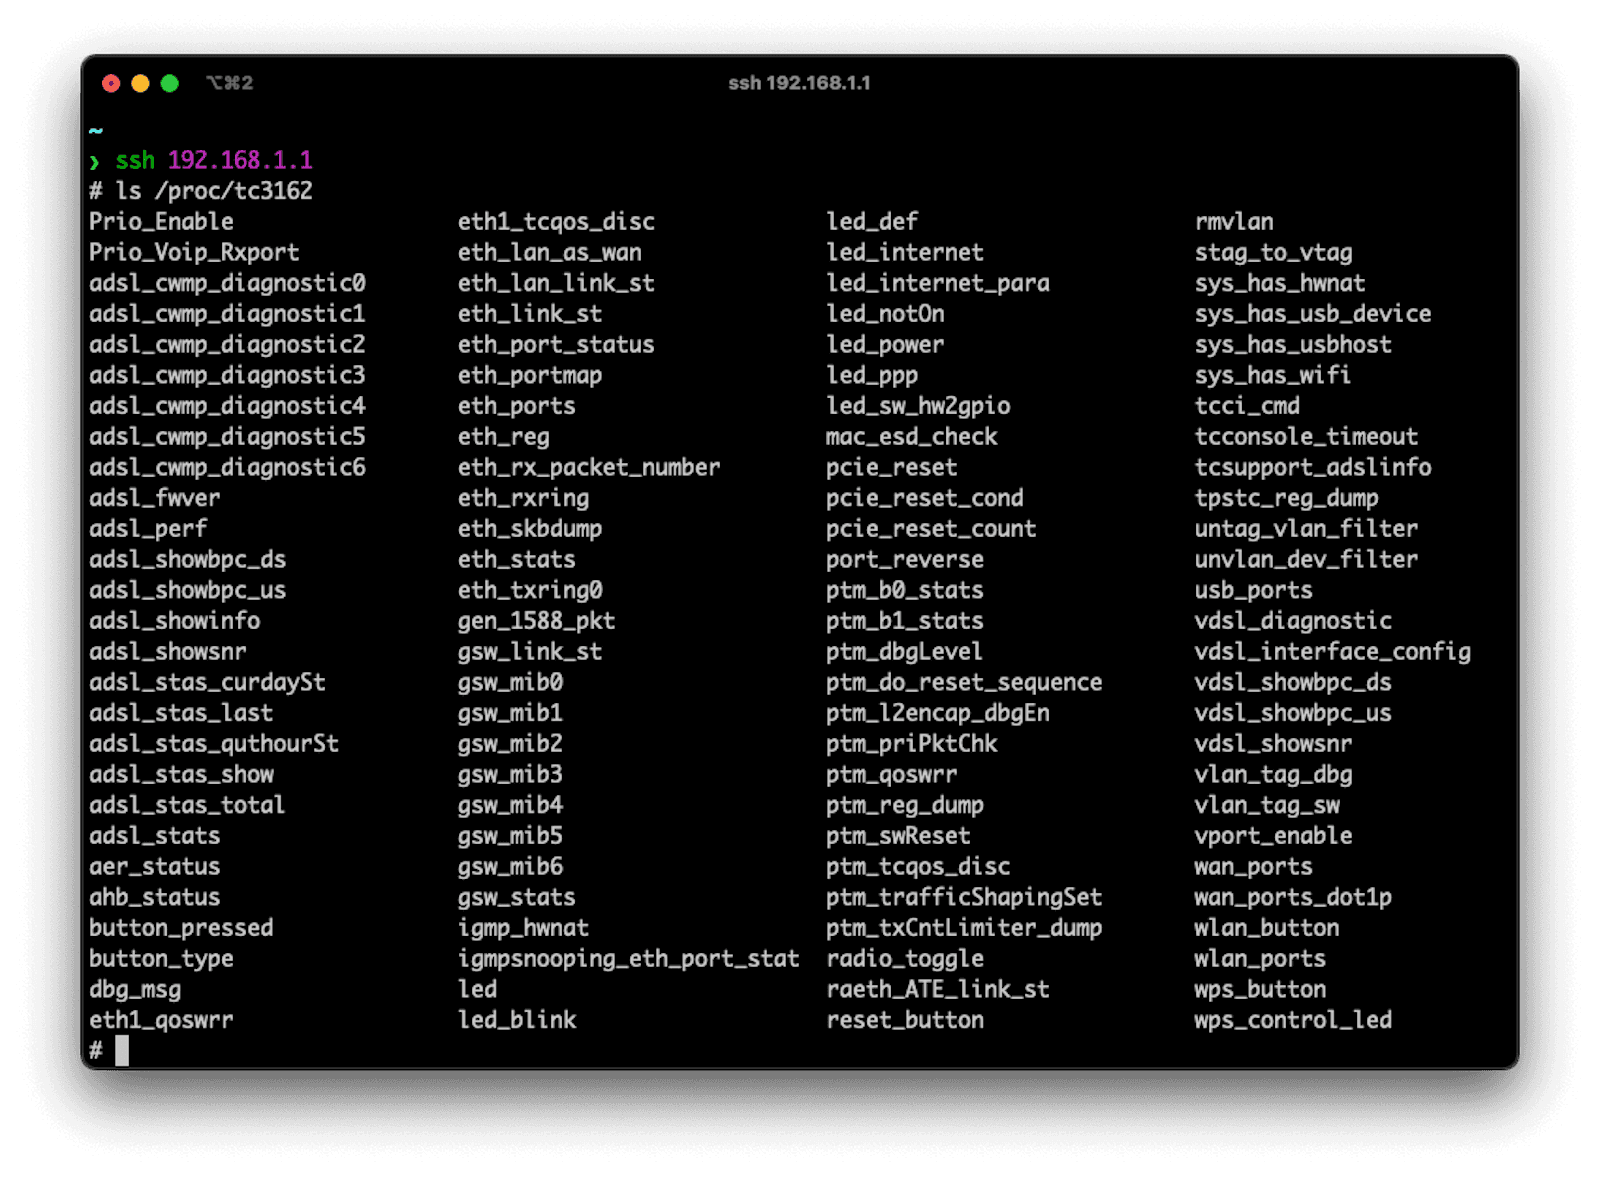
This is the pseudo-filesystem of the TC3162 firmware that we can read and then extract the metrics. Notice that these files are not executables. However, since I’m unfamiliar with internals, I think the TC3162 chip executes some commands and writes results as outputs under this directory.
Are you thinking what I was thinking? Let’s scrape them!
Before writing a custom scraper specifically for TC3162, I wanted to search the entire GitHub to see if there is already a library that handles this kind of stuff. I was looking for a more generic solution with wider support for various vendors. Using GitHub Code Search I queried exactly this: "/proc/tc3162/vdsl_showsnr". Check out what I saw:

YES! I jumped into the actual project, which was developed under Mozilla and written by Jan Hoffmann, and it featured an xDSL Stats Parser. It explained that “go-dsl is a library for reading basic xDSL stats, as well bitloading, SNR, QLN and Hlog data and supports various kinds of modems.” I’m not sure about the original use case, but it’s serving on 3e8.eu/go/dsl.
My next step was to find an exporter to scrape the CPU, MEM, network, and filesystem metrics. I searched for ssh exporters and ended up on a Grafana Community page: “Remote Server Monitoring over SSH.” The author, Dennis Hoer, referenced a tool called rtop and explained that it is “a simple, agent-less, remote server monitoring tool that works over plain SSH. It does not need any software installed on the server you want to monitor. It works by establishing an SSH session and running commands on the remote server to collect system metrics.”
For many reasons, though, it wasn’t the game-changer I needed for my project.
There were two ways I could go next: search for another similar project in the GitHub ocean, or refactor the entire codebase from scratch and maintain my fork. I decided on doing a simple surgical operation by refactoring. I thought node-exporter would be a perfect fit for this, but unfortunately, it does not have remote SSH support and I couldn’t install any binary on the modem because there was no disk space.
Implementation
In order to move forward, I needed to write a Prometheus Exporter from scratch. Prometheus Exporter bridges the gap between Prometheus and applications that don’t export metrics in the Prometheus format. Once you expose a /metrics endpoint, it allows you to export metrics from the application and import them to Prometheus. That way, you can collect any metric you want, in any way you want. (In case you need it, here’s a guide to writing a Prometheus Exporter.)
Importing go-dsl
The first step is to import go-dsl. It’s so nicely designed that initializing the client is easy. I imported all the clients in the main.go:
_ "3e8.eu/go/dsl/broadcom"
_ "3e8.eu/go/dsl/draytek"
_ "3e8.eu/go/dsl/fritzbox"
_ "3e8.eu/go/dsl/lantiq"
_ "3e8.eu/go/dsl/mediatek"
_ "3e8.eu/go/dsl/sagemcom"
_ "3e8.eu/go/dsl/speedport"
After you provide necessary configs to the go-dsl client, all you have to do is to get current data as the following:
if err := e.dsl.UpdateData(); err != nil {
    return err
}

status := e.dsl.Status()
Use status struct to access all the current data.
Refactoring rtop
I spent almost half a day just refactoring rtop so we can use it as a dependency with customizable options during initialization. I also changed a bunch of things to support backward compatibility. I made noticeable changes to Go modules, the package system, fixed tiny bugs, added missing fallback commands, used https://charm.sh/ for rendering, and more. (You can find the refactor commit here.)
The result:
8 files changed, 808 insertions(+), 433 deletions(-)
Now it’s ready to use as a public library.
Initializing Prometheus Exporter
I basically followed the general rules of instrument code with a Prometheus client library, and initialized the project as a cobra application for better command and flag management. Then, I used the exporter-toolkit library for a resilient web server. The client_golang package is another essential must-have core library. The common package is the way to go for config management, logging, routing, and so on. (A nice starting reference point for this is minecraft-prometheus-exporter, which was created by Engin Diri.)
After the initialization of both rtop and go-dsl clients, I was able to use these in the actual exporter logic. Here are the steps I took:
1. Defined the metrics
var uptime *prometheus.Desc
uptime = prometheus.NewDesc(
         prometheus.BuildFQName(Namespace, SubsystemDsl, "uptime"),
         "Uptime of the DSL modem.",
         []string{"uptime"},
         nil,
         ),
2. Described the metrics
func (e *Exporter) Describe(descs chan<- *prometheus.Desc) {
descs <- e.uptime
}
3. Collected the metrics
func (e *Exporter) Collect(metrics chan<- prometheus.Metric) {
metrics <- prometheus.MustNewConstMetric(e.uptime, prometheus.UntypedValue, 1, “my_status”)
}
You can define as many metrics as you want. In the main() function, you basically run a web server in the background, register your exporter to Prometheus using prometheus.MustRegister(exporter), handle interruption signals, client initializations, and logging interface.
That’s it! Writing an exporter is that easy. Thanks to the Prometheus team for creating a great developer experience. The source code is at the end of this post.
Configuration
How will our exporter communicate with the modem? With SSH, of course! Therefore, we need to log into the modem’s interface and activate the SSH, and set our new key.
Enabling SSH on the modem
To do this, you must have an xDSL modem that is set up correctly and running. Additionally, you should generate a new SSH key-pair using ssh-keygen for passwordless login:
$ ssh-keygen -t rsa -f ~/.ssh/id_rsa_modem -q -N ‘’
Copy your public key and put it into Authorized Keys in the modem settings:
$ cat ~/.ssh/id_rsa_modem.pub

Also, don’t forget to set Idle Timeout to 0 since go-dsl does not support a reconnecting feature yet.
Currently, the supported clients are: Broadcom, DrayTek (Telnet), FRITZ!Box, Lantiq, MediaTek, Sagemcom, and Speedport.
Preparing your Grafana Cloud account
If you don’t already have a Grafana Cloud account, you’ll need to sign up for one then set it up by following the instructions.
Another important step is to create a Prometheus instance on Grafana Cloud. Find the Integrations and Connections tab on the left bar, and jump into Hosted Prometheus metrics service. Make sure you have selected Via Grafana Agent as a forwarding method.

Generate your API key and store that somewhere secure. Also, copy the Remote write endpoint since you’ll use it later.
After you choose your platform, you can download the Grafana Agent binary from there. Also, don’t forget to give a star for grafana/agent on GitHub!
Preparing Grafana Agent
You need to prepare a configuration file to provide to the agent:
metrics:
  wal_directory: /tmp/grafana-agent-wal
  configs:
    - name: integrations
        remote_write:
              - basic_auth:
                    password: $API_KEY
                    username: $USERNAME
              url: $REMOTE_WRITE_ENDPOINT
       scrape_configs:
             - job_name: integrations/xdsl
               metrics_path: /metrics
               scrape_interval: 15s
               static_configs:
                     - targets: ['localhost:9090']
server:
  http_listen_port: 12345
  log_level: debug
You should customize the variables with your configurations — just replace the environment variables with the actual values. Please notice that xdsl-exporter exposes the metrics at the /metrics endpoint on the 9090 port. Save the configuration above as config.yml.
Getting things up and running
It’s time to make our abstract work tangible. We are going to run our exporter to see all metrics on Grafana Cloud.
Prerequisites
First, run the xdsl-exporter:
$ git clone git@github.com:Dentrax/xdsl-exporter.git
$ cd xdsl-exporter
$ go run . --target-client mediatek_ssh --target-ssh-key-path ~/.ssh/id_rsa_modem
Then, run the grafana-agent:
$ ./agent-darwin-amd64 --config.file config.yml
You can define a service to start the programs automatically after the boot process: systemsd service, Brew services, or use the startup folder to launch scripts. If you already have a home server, it would be much easier to deploy.
Creating an xDSL Exporter dashboard on Grafana Cloud
To create a new dashboard, go to: https://USERNAME.grafana.net/dashboards. Click New and select Import. Download the JSON file here and import it to the dashboard.
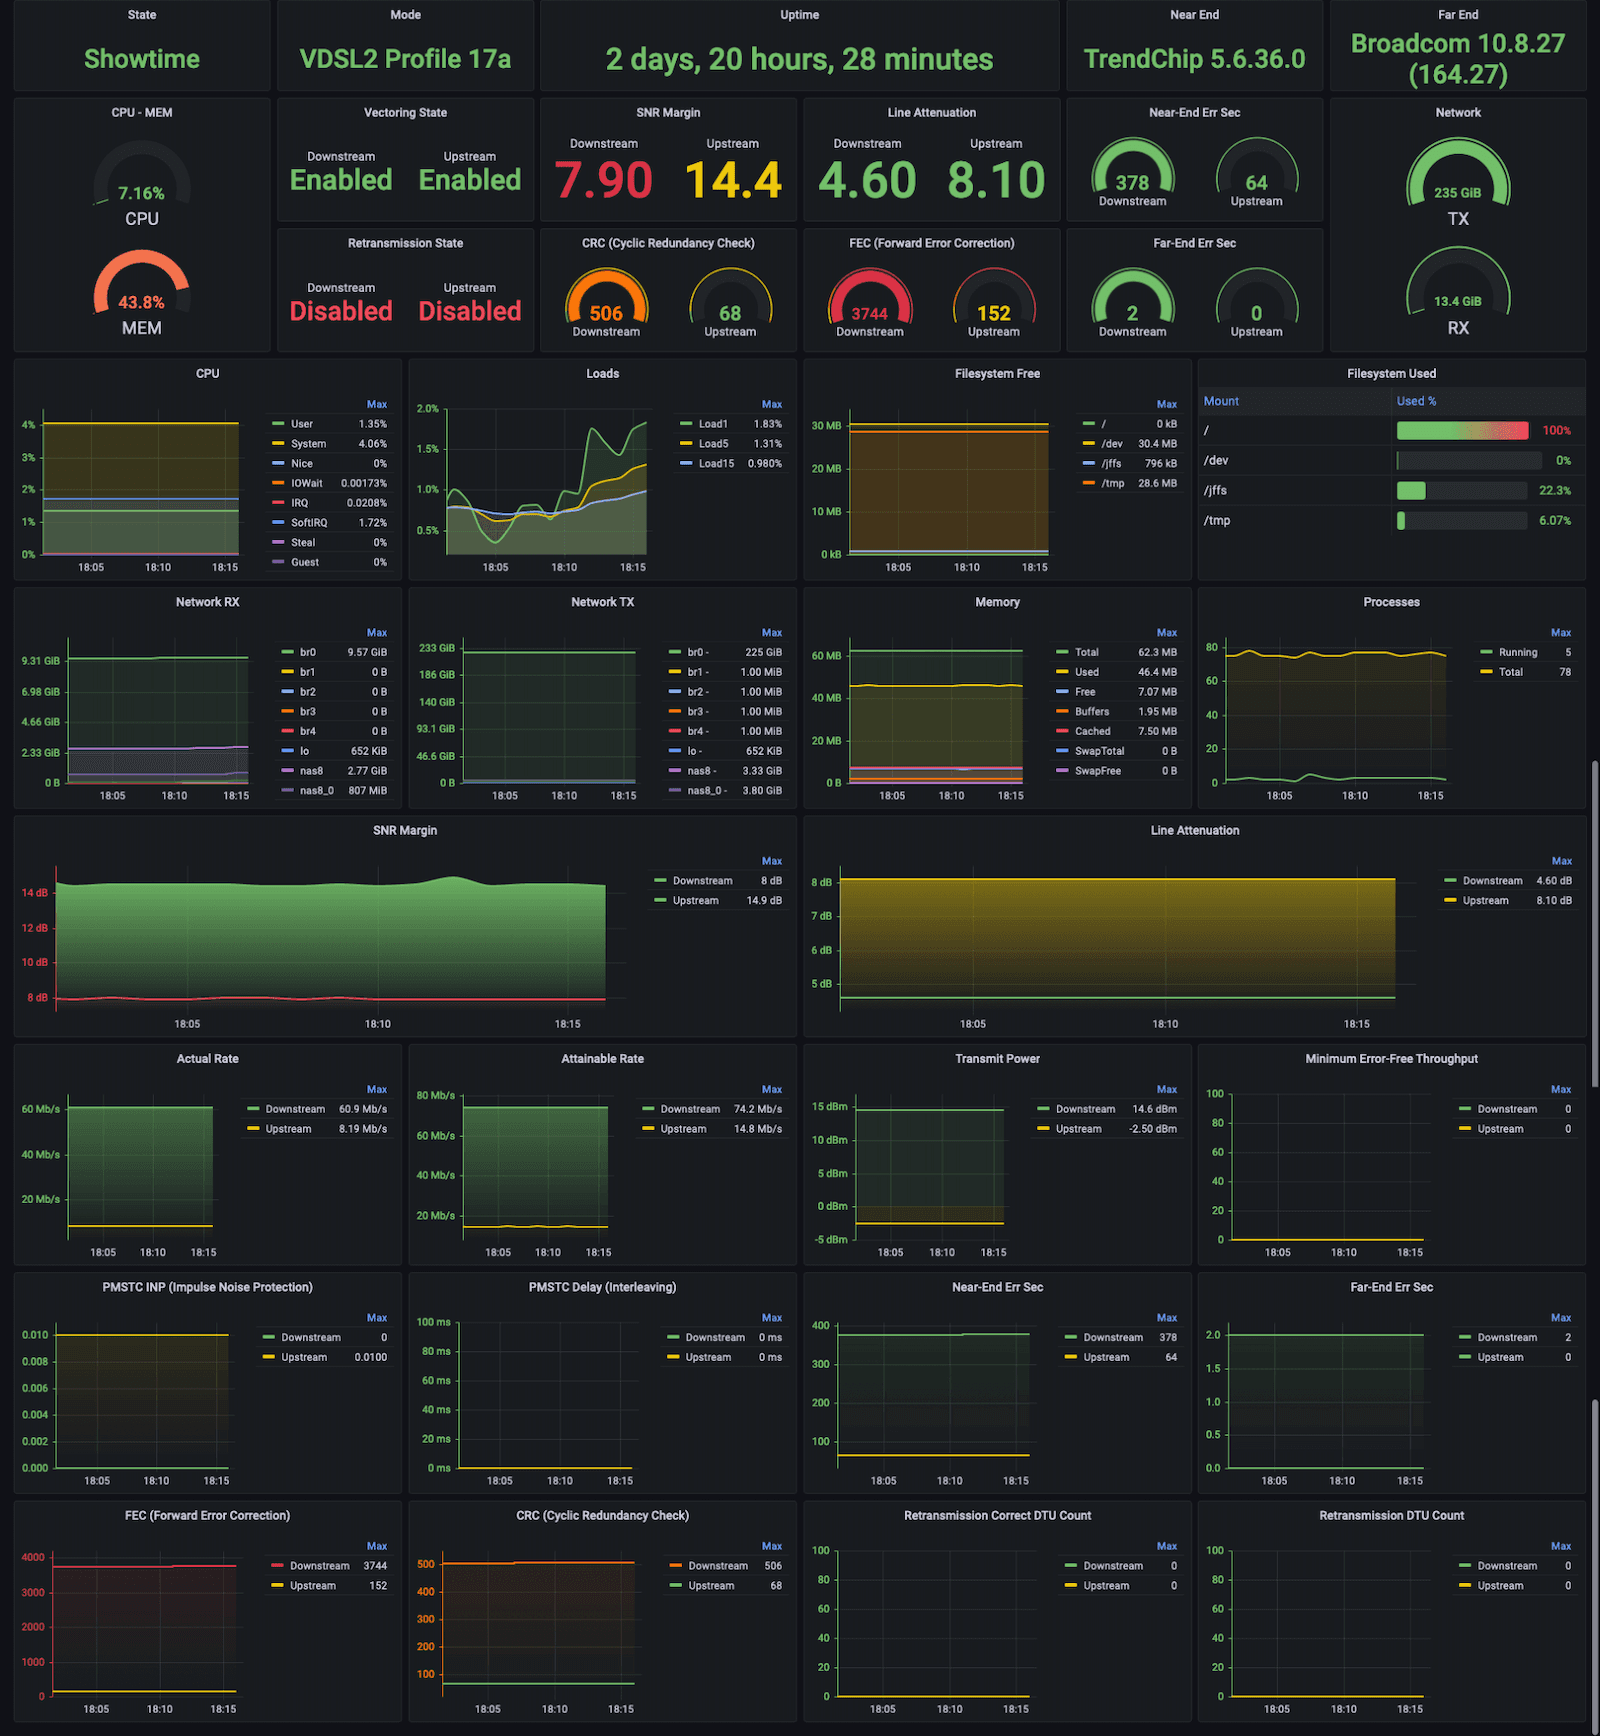
Time to lift off! Open your xDSL dashboard and you should see something like this:

If you’re somewhat familiar with xDSL terminology, I can already see the smile on your face! Some of the most important values are SNR Margin, Line Attenuation, and packet drops (CRC, FEC). Visualizing everything together is really useful.
Bonus: Grafana OnCall and Alerting
While I was exploring Grafana Cloud for the first time, I noticed Grafana has its own alert management system. This meant I didn’t need to manage my own AlertManager anymore.
I also like the new Grafana OnCall management tool. It’s easy to configure and provides flawless integration with Slack, SMS, Telegram, and Microsoft Teams notification providers. And it’s free! In this demo, we are going to use Telegram since it’s my daily basis app. You can set it up in just five minutes.
Initial setup
Grafana has an official YouTube channel that features some helpful videos. One is “On-call management with Grafana OnCall.” I suggest watching that before continuing.
What I needed to do was to create an alert for SNR margin drops.
SNR margin is the extra amount of signal strength beyond the minimum required for a reliable communication to ensure a stable and consistent connection. It is generally recommended to have an SNR margin of at least 6 dB to ensure a stable and reliable connection.
I want this value to be at least 8 in my own home network because network drops are starting to occur. That’s why I have set up a special alarm for this.
On the left bar of the dashboard, click the Grafana OnCall icon. Then jump to the Integration page to define new integration.
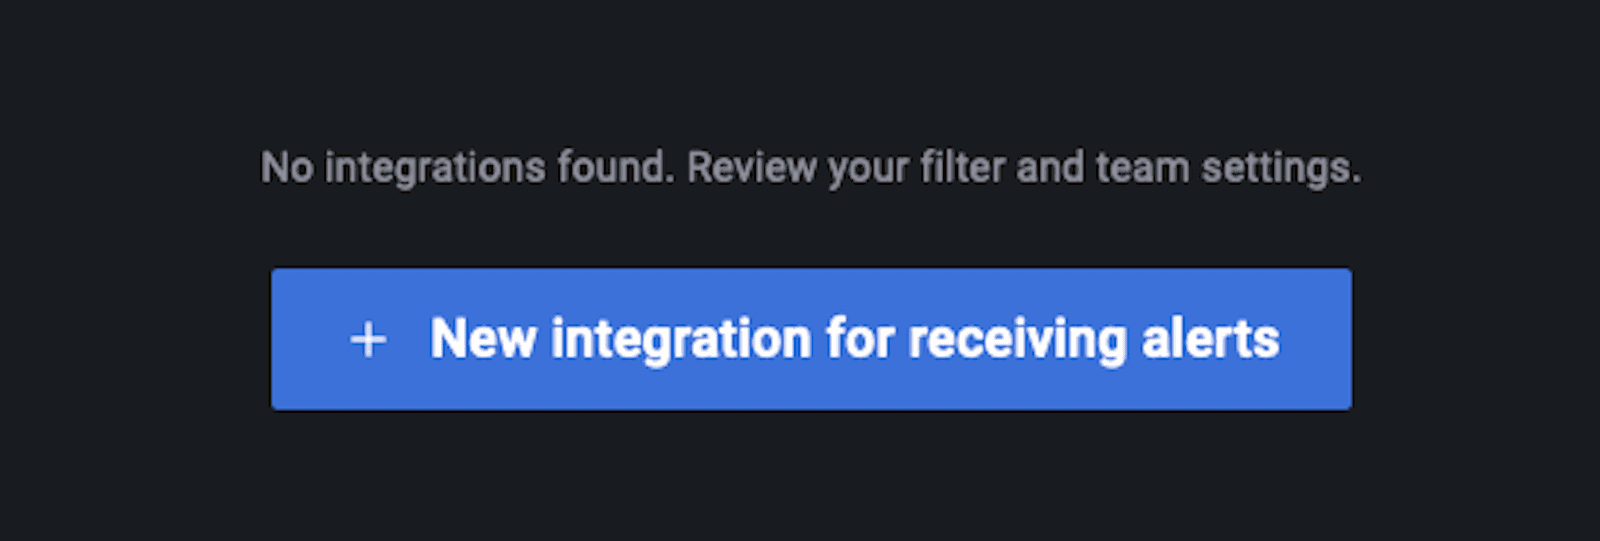
You should configure the Grafana Alerting integration in this step. Then, click the New integration for receiving alerts button to open the Create Integration page.

After a few seconds, a popup will appear on the right side. Note that webhook URL for later use. Read the description and click the Open Escalations Settings button.
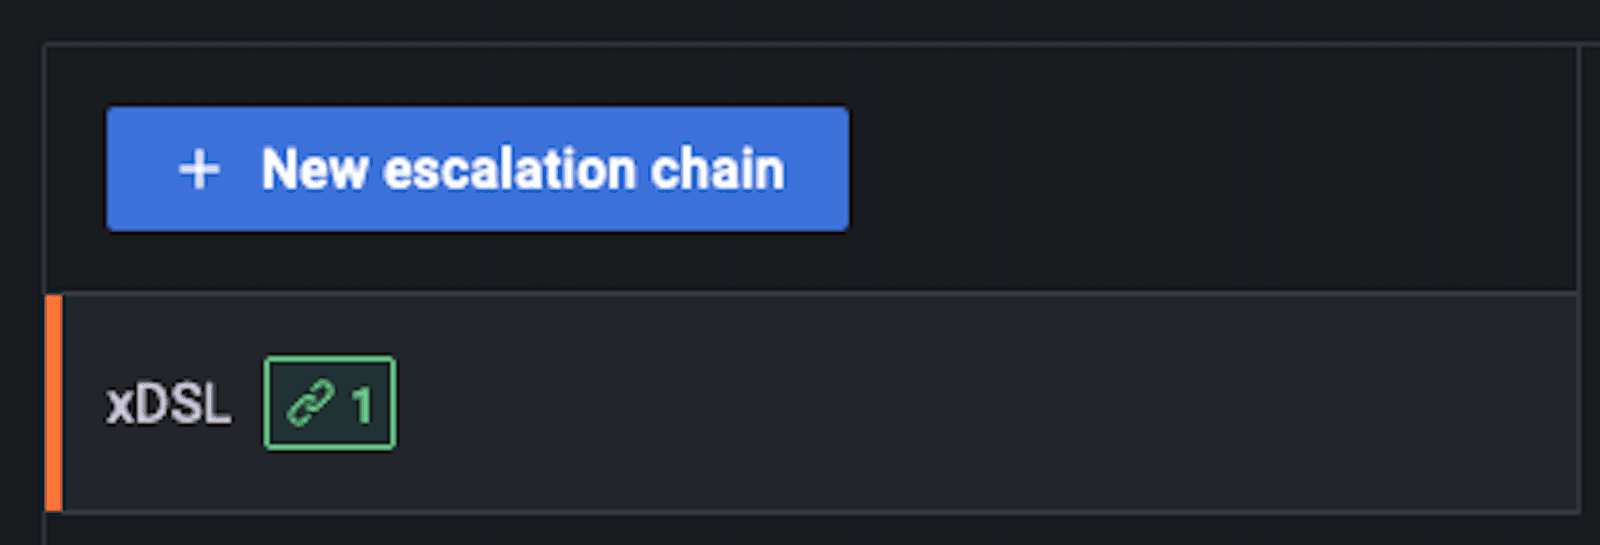
Use the tab to create an New escalation chain. I named mine “xDSL.”
After you create a new escalation chain, jump into the ChatOps tab. I went with Telegram in this demo, but you can select different notification options. Press the Connect Telegram Channel button and this popup will appear:
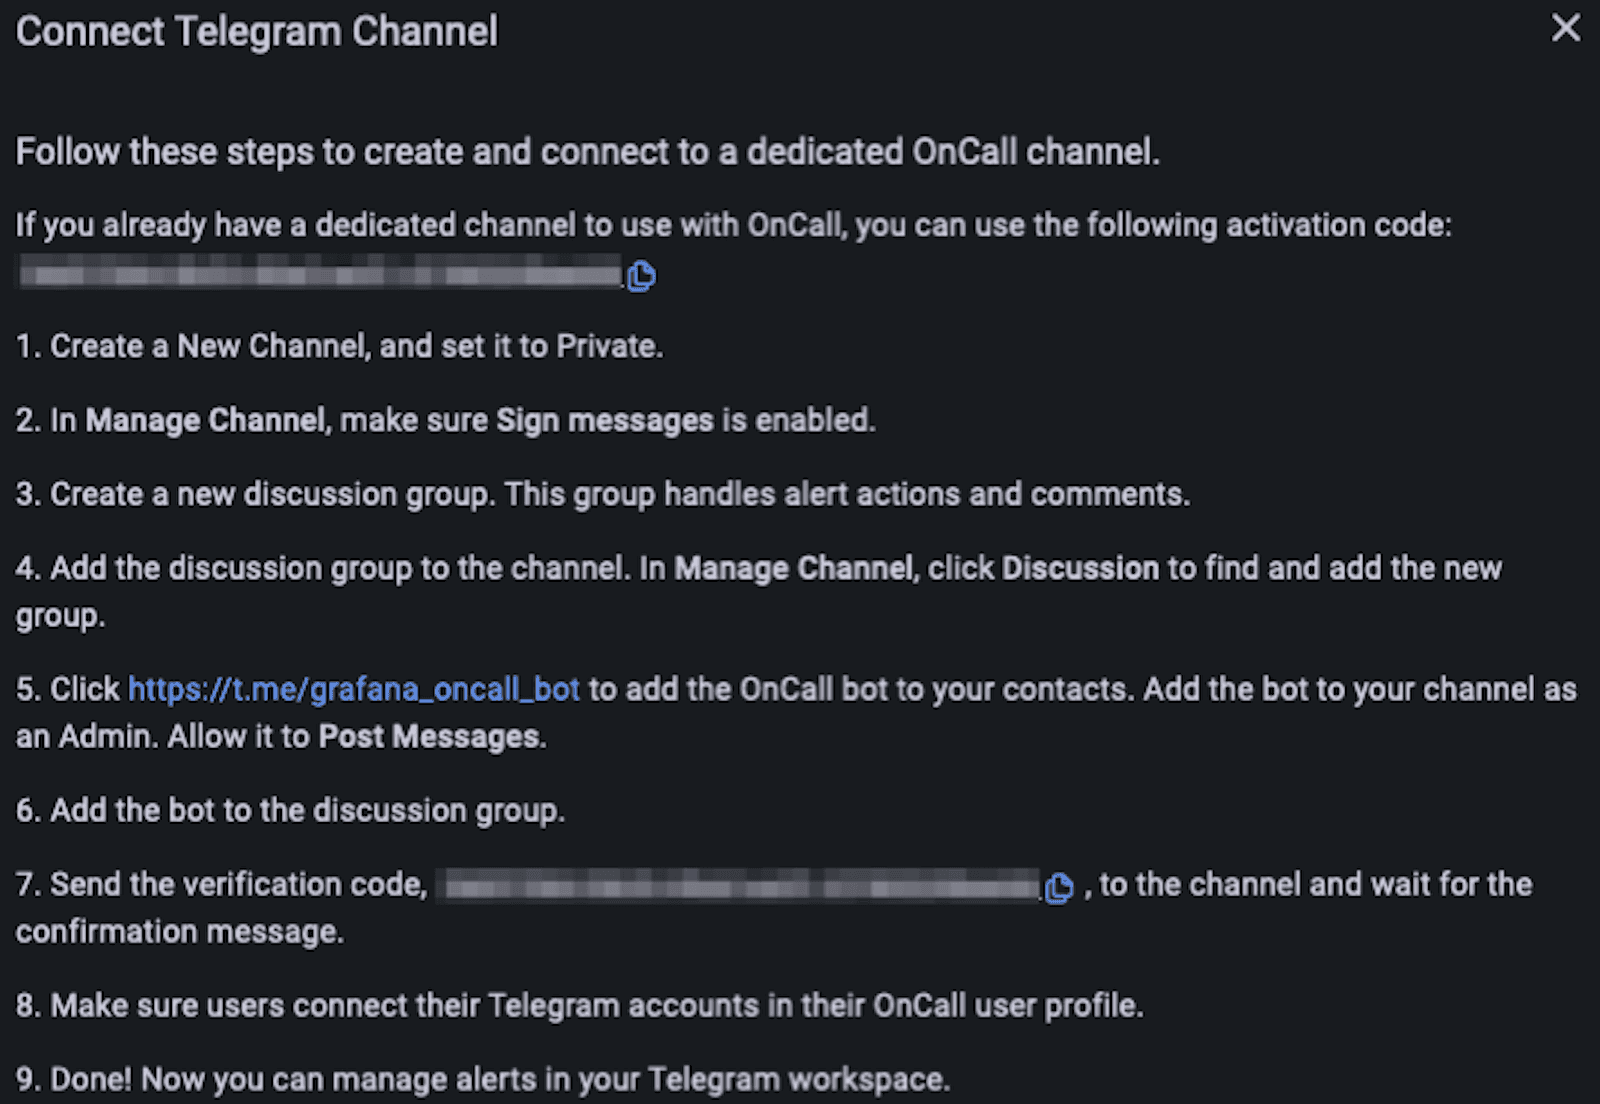
This is cool, right? Grafana navigates us very well.
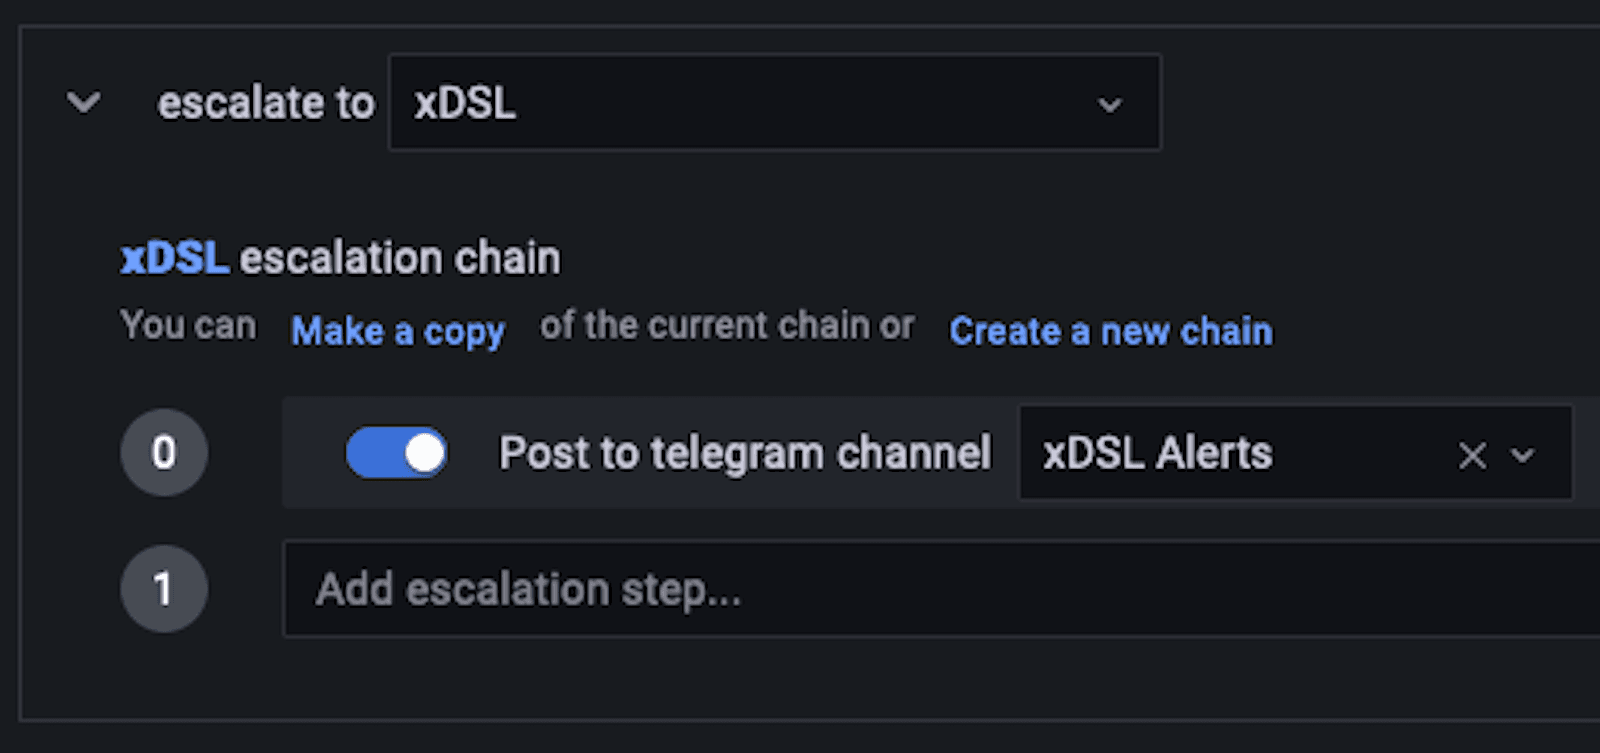
After you have completed all nine steps, jump back to the Integrations tab and add your Telegram to your escalation:
When you’re ready, send a test notification. If you successfully received it on your channel, it’s time to define a new alert.
Define a simple alert
Grafana has a video called “How to create an alert in Grafana”. You can check it out before continuing.
On your Grafana dashboard, click the Alerts icon on the left sidebar. To define a simple alert rule, press the New Alert Rule button. Remember that we use Grafana Managed Alerts, so select that. Then choose your correct Prometheus Data Source.
I will use the xdsl_dsl_snr_margin_downstream metric to check if SNR Margin drops lower than 8. Evaluating every 1m for 5m is fine for now.
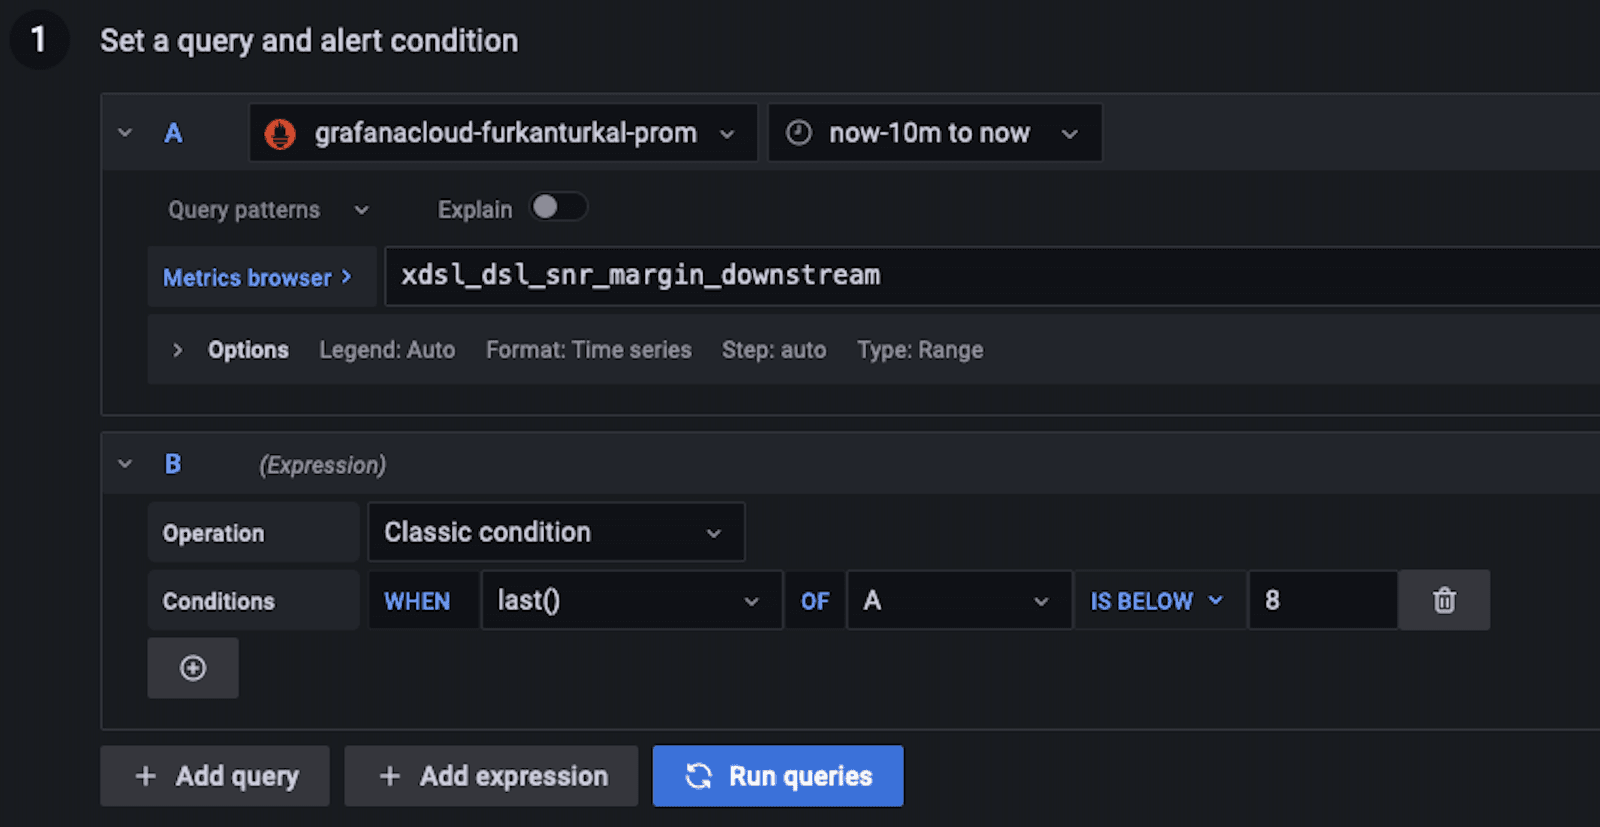
Since this metric is in the dsl sub-namespace, I gave it a DSL Monitoring group. You can create another RTOP Monitoring for rtop sub-namespace metrics. Filling your Dashboard UID and Panel ID would increase the UX and allow for a fast jump to the dashboard from the incident notification. Finally, consider adding a clear Summary of the alert.

Save, exit, and wait for an alert . . .
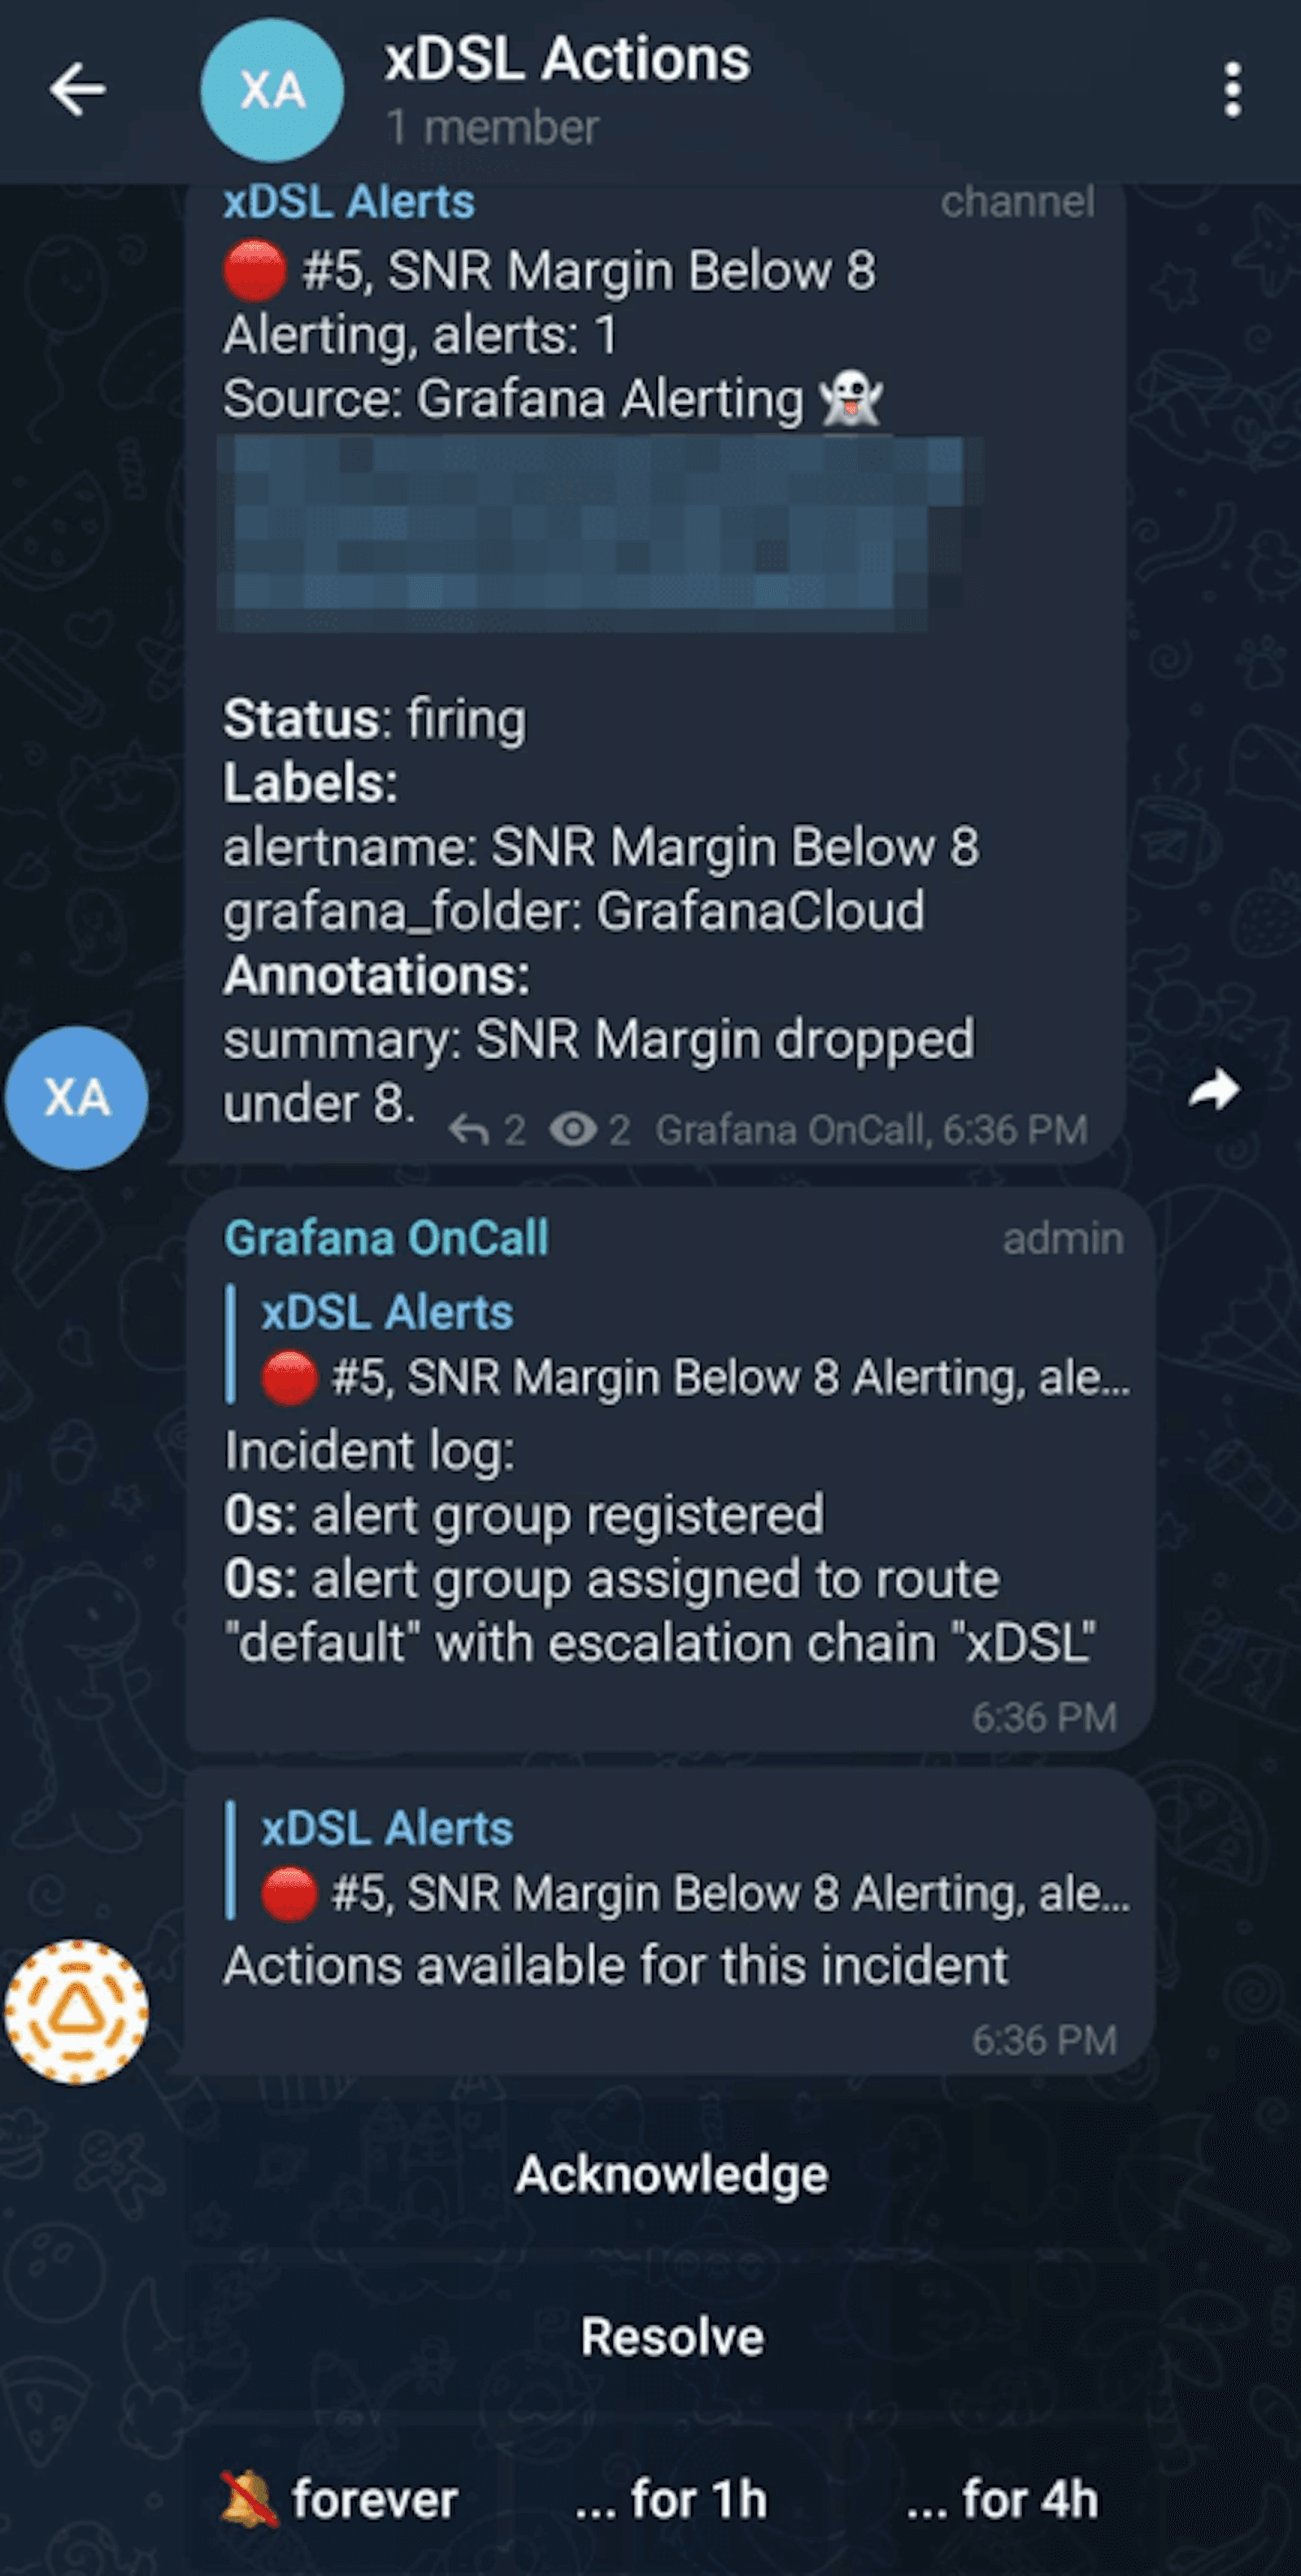
Success! Works like a charm!
On rainy and windy days, SNR Margin can drop to as low as 7 and network outages become inevitable — and it was one of those days.
When you get an alert, click the Acknowledge button to indicate that you have received and understood the alert by taking some action. Now call your ISP and say: “Hey, due to very unstable DSL line noise, I couldn’t work from home. Could you please adjust my line variables?”
Press the Resolve button when they take the necessary action and refresh your network line.
Over and out
Implementing a Prometheus Exporter from scratch was a lot of fun for me. And when I was able to visualize the metrics I exposed on a Grafana dashboard, I became the world’s happiest man. Now that I can see everything that’s happening on my modem very clearly, I can convey any issues to my ISP accurately whenever I run into a network issue.
Looking back on how to improve this project, I think it would be great to use predefined alert config files for better maintainability. Defining alerts is fun, but it’s not sustainable to keep doing it one-by-one. Having some unit tests would be fine, too.
There are also some known issues such as SSH connection drop issue and null version label in info metric. I can’t wait to have support for Fibre Optic modems with ONT/GPON monitoring. This PoC project is still a baby and looking for contributions.
If you enjoyed this project and want to give me kudos, please give it a ⭐️ on GitHub — and don’t forget to share it. (If you want to be informed about my other projects, you can follow me on Twitter.) I am waiting for your feedback. Ping me anytime. Have a very safe and productive day!
Want to share your Grafana story and dashboards with the community? Drop us a note at stories@grafana.com.

