
How to migrate existing Grafana dashboards and alerts into Kubernetes Monitoring in Grafana Cloud
Kubernetes Monitoring in Grafana Cloud is already an observability Swiss Army knife: You can monitor your Kubernetes fleet performance, nodes, pod logs, resource utilization, and overall infrastructure health all in one hosted platform that comes with prebuilt Grafana dashboards to visualize all the important telemetry you need.
All of this sounds great … but what if you already have Grafana dashboards and alerts that are custom to your fleet and the way you do business?
This set of three guides will show you how to unify new and existing Grafana dashboards and alerts within the Kubernetes Monitoring solution in Grafana Cloud. By doing so, you will create one dedicated place for monitoring your entire Kubernetes fleet. No more tab switching or confusion; just streamlined infrastructure monitoring in a single view.
In the end, whether you are just getting started with Kubernetes or integrating years of work into our solution, you will benefit from all the new capabilities we continually roll out to our Kubernetes Monitoring solution, all while having the flexibility to incorporate your own custom content.
Note: You will need Admin access to execute the steps outlined in this document. To learn more read our blog post about role-based access control in Grafana.
Migrating existing Kubernetes alerts to Grafana Cloud
Problem: I have existing Kubernetes alerts. I want to keep using them in the same dedicated place for my whole team to see.
Step-by-step guide:
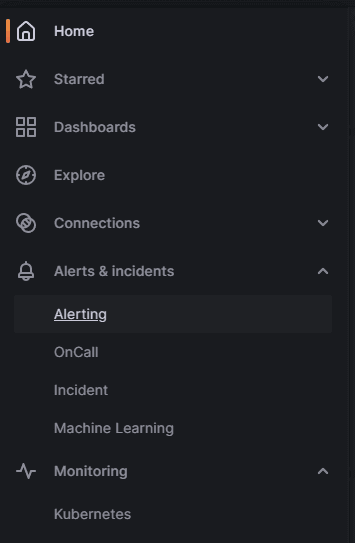
- Go to Alerts & incidents (bell icon) on the left-hand navigation:

- Pick Alert rules:

Now you are in your alerts control center. The only thing you need to do is move an existing alert to your Kubernetes Monitoring namespace.
3. Search for a Prometheus data source:

4. Find your desired alerting group and hit Edit: (Note: You can only transfer Grafana Mimir/Loki alerts.)

5. Scroll to the Namespace and group section and simply change the fields to:
Namespace: integrations-kubernetes

Group: kubernetes-resources / kubernetes-apps / kubernetes-system

You will end up with something like this:

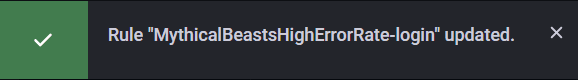
6. Hit Save at the top, and you should receive a happy message:
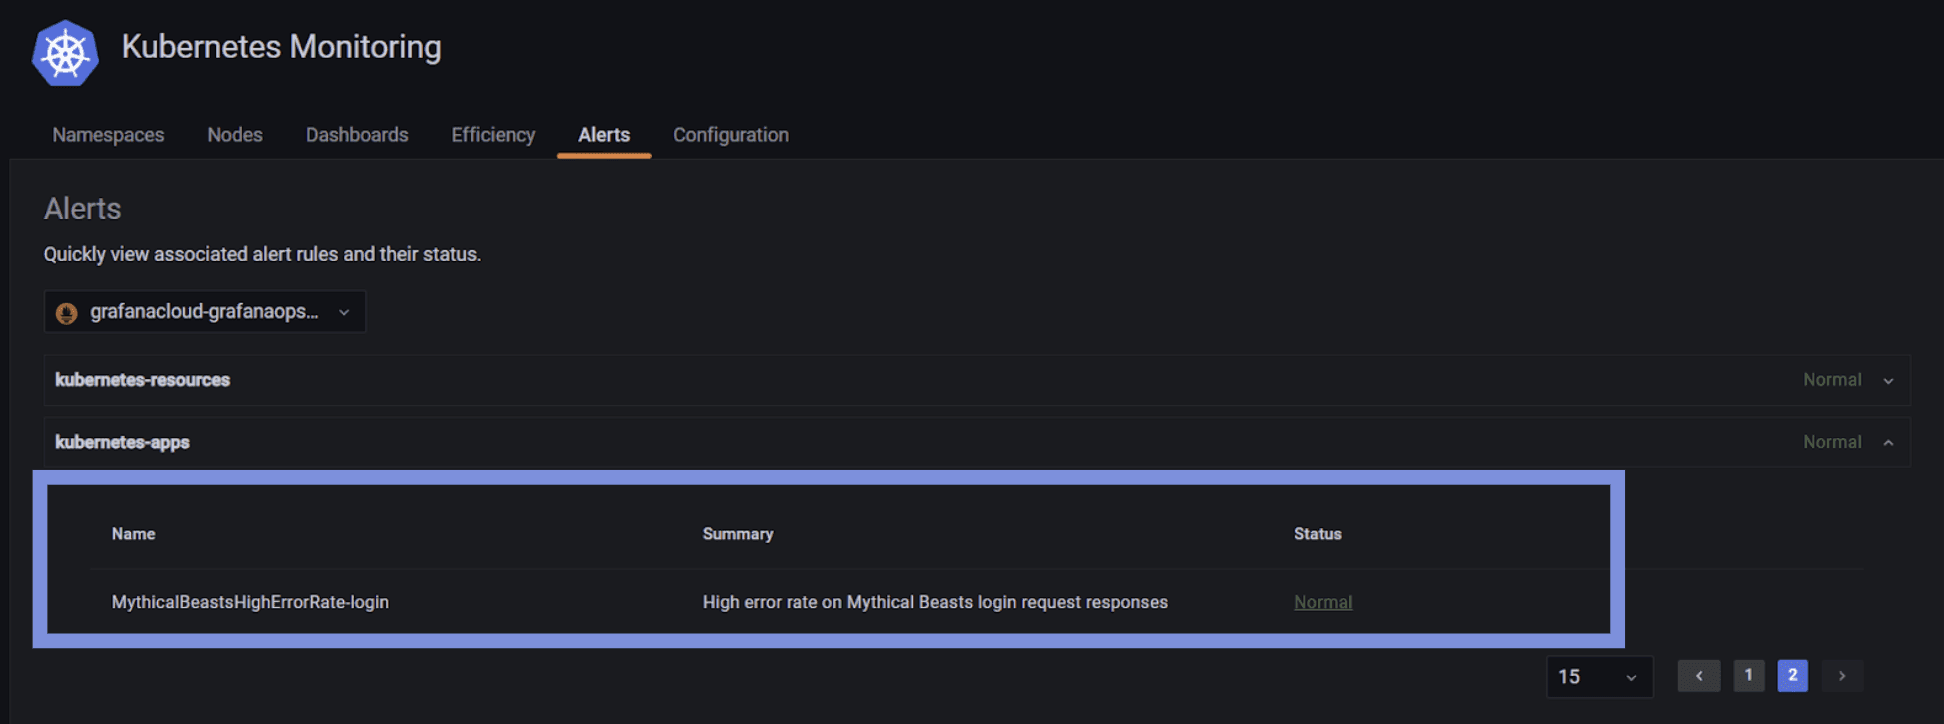
- Now when you navigate back to the Alerting tab in Kubernetes Monitoring
Ta-da! You’ll find this new rule group:
If it fires, you will also be able to see it here:

Problem: I want to creating new alerts and move them into Kubernetes Monitoring
Step-by-step guide:
1. Create a new alert rule:

2. Choose Mimir or Loki alert type:

3. Select your Prometheus datasource:

- Follow steps from 4 - 7 from the guide above.
You now have a single pane of glass for all your Kubernetes alerts in Grafana Cloud. Your SREs, developers, and infra admins will see firing alerts in the Cluster navigation, separate from every other non-Kubernetes alerting systems you have set up. The best part is that you don’t even have to recreate your alerts from scratch.
Migrating existing Grafana dashboards for Kubernetes to Grafana Cloud
If you want to reinforce Kubernetes Monitoring as your single source of truth for your infrastructure observability strategy, you can also move existing Grafana dashboards to Kubernetes Monitoring or create new dashboards that will appear alongside prebuilt dashboards in the solution.
Problem: I want to migrate my existing Kubernetes dashboards to Kubernetes Monitoring in Grafana Cloud.
Step-by-step guide:
- Find an existing dashboard that you want to move:

2. Open it and go to Dashboard settings:
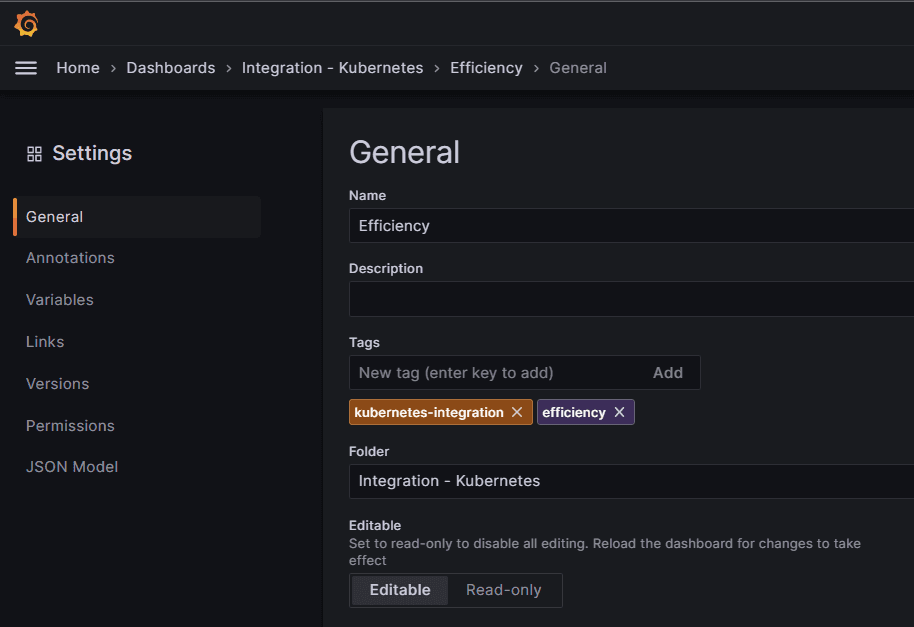
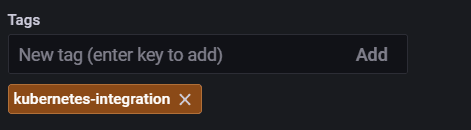
- Add a tag
kubernetes–integration(no spaces, all lowercase). Then click Add. The result looks like this:
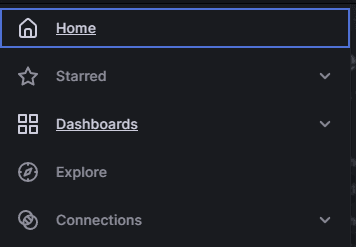
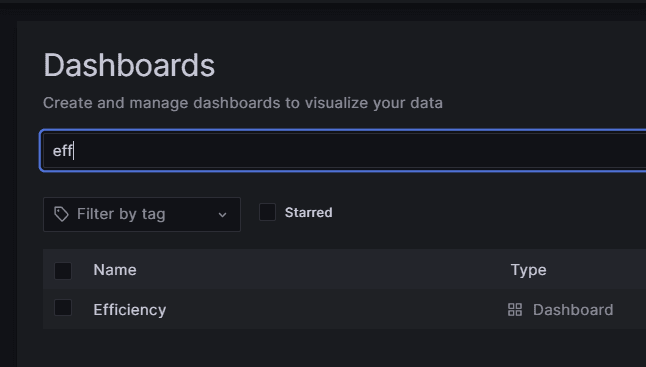
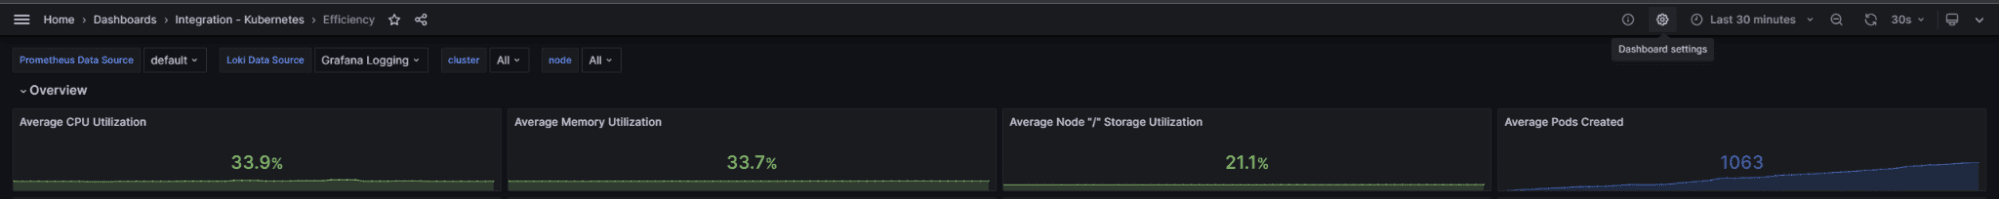
- Hit Save and you are all set. Go to Dashboards on the Kubernetes Monitoring page

and you’ll see your dashboard was added to your list:

… and you are done! Now you have a dedicated place for monitoring your Kubernetes fleet that will serve your whole organization.
Note: Make sure you add an additional tag like Custom K8s so you can track the custom content that you add to the solution. This is needed because every now and then you need to update the solution. When that happens, you’ll have to detach the custom content by moving it out of the Integrations-Kubernetes folder, update the solution, and then reattach them. It is an inconvenience that will soon be fixed.
Learn more about Kubernetes Monitoring in Grafana Cloud
By unifying your existing dashboards within Grafana Cloud, you’re ultimately building a Kubernetes ecosystem that is personalized to your needs and more powerful because of the added out-of-the-box features that our Kubernetes Monitoring solution has to offer.
To learn more about Kubernetes Monitoring in Grafana Cloud, visit our solutions page or watch our Kubernetes Monitoring out-of-the-box with Grafana Cloud webinar on demand.
If you’re not already using Grafana Cloud — the easiest way to get started with observability — sign up now for a free 14-day trial of Grafana Cloud Pro, with unlimited metrics, logs, traces, and users, long-term retention, and access to one Enterprise plugin.

