AWS Fargate monitoring: How to collect serverless logs, metrics, and traces in Grafana
Interoperability — it’s one of the main reasons I joined Grafana Labs. Our “big tent” philosophy helps Grafana work with a wide range of data sources and tools, and it’s why you can use Grafana to address endless use cases and problems.
We are best known for the seamless way we correlate metrics, logs, and traces to understand what is happening in the environment, resolve the immediate issue, and address any underlying issues so that it does not happen again. However, having used Grafana during my time spent working at AppDynamics, Google Cloud, and most recently AWS, I know Grafana can also visualize cloud cost and utilization data, cloud resource inventory, and APM dashboards, amongst other unique use cases.
Shortly after joining Grafana Labs in October 2022, I noticed quite a few questions both internally and in the community forums about serverless monitoring (specifically AWS Fargate, which is near and dear to my heart, given my time at AWS) and how Grafana does this. Those questions became the inspiration for this blog post, in which we’ll walk through how Grafana and the Grafana Agent take the complexity out of monitoring serverless environments.
Serverless 101
If you’ve spent time in the cloud computing world, you’ve heard about serverless computing, which abstracts the underlying infrastructure so developers can just focus on building and running code. Serverless has taken off recently as organizations have opted to move away from the complexity and cost that comes with both physical servers and virtual machines.
AWS Fargate is a serverless compute engine for containers that work with Amazon Elastic Container Service (ECS) and Amazon Elastic Kubernetes Service (EKS). Fargate and AWS Lambda, an event-driven serverless offering from Amazon, are two of the most popular serverless solutions on the market today.
And while many developers look to serverless as a way to move away from complexity, there is still quite a bit of it to deal with. That’s especially true when it comes to troubleshooting and monitoring.
How Grafana helps you monitor Fargate
The dynamic nature of serverless environments makes them difficult to monitor. To fully understand how all your workloads are performing and how they’re using Fargate resources over time, you need to visualize and alert on comprehensive monitoring data in a single platform.
Doing this with Grafana is simple. Under the hood, the Grafana Agent collects and sends the metrics, logs, and traces to Grafana Cloud. Once the Grafana Agent has been set up, deployed, and configured, you can see the critical metrics, logs, and traces in your Grafana instance.
Grafana helps you monitor your applications, containers, and the ephemeral Fargate infrastructure that supports it all. This removes the complexity and allows you to easily troubleshoot your Fargate clusters.
How to get started
To get started, you’ll want to set up an account on Grafana Cloud so you can visualize your Fargate data. (If you already have an account, you can skip this step. If not, you can sign up for free here.)
Next, we’ll use the Grafana Agent to collect and send metrics to our Grafana Cloud instance. The Grafana Agent is a telemetry collector that allows you to send metrics, logs, and traces to your Grafana stack with just one YAML file. Serverless monitoring is typically limited to the metrics the host platform provides. However, this solution provides a level of granularity you don’t get natively with AWS.
Once your Grafana account is running, install the Grafana Agent in a sidecar on your Fargate cluster. (Full documentation on this is coming soon!) And that’s it — it really is that simple! Once you have configured your Grafana Agent YAML file, the agent will send metrics, logs, and traces to your Grafana stack, so you don’t have to worry about any additional steps or configuration choices.
Be sure to follow the instructions that align with the OS platform you use on Fargate. If you are using Amazon Linux, you will want to follow the RPM-based Linux instructions here.
Integration with a variety of sources
Grafana has many other integrations that fetch data from users’ systems, everything from Amazon CloudWatch to data in SQL, Prometheus, and other sources. You can also use the CloudWatch integration to add other AWS environment-specific details to your monitoring environment. This helps you get a fuller picture of the state of your system and the various components it relies on.
Contextual layouts and visualizations
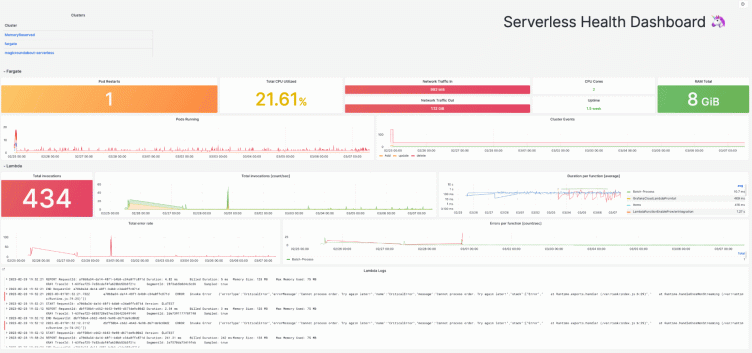
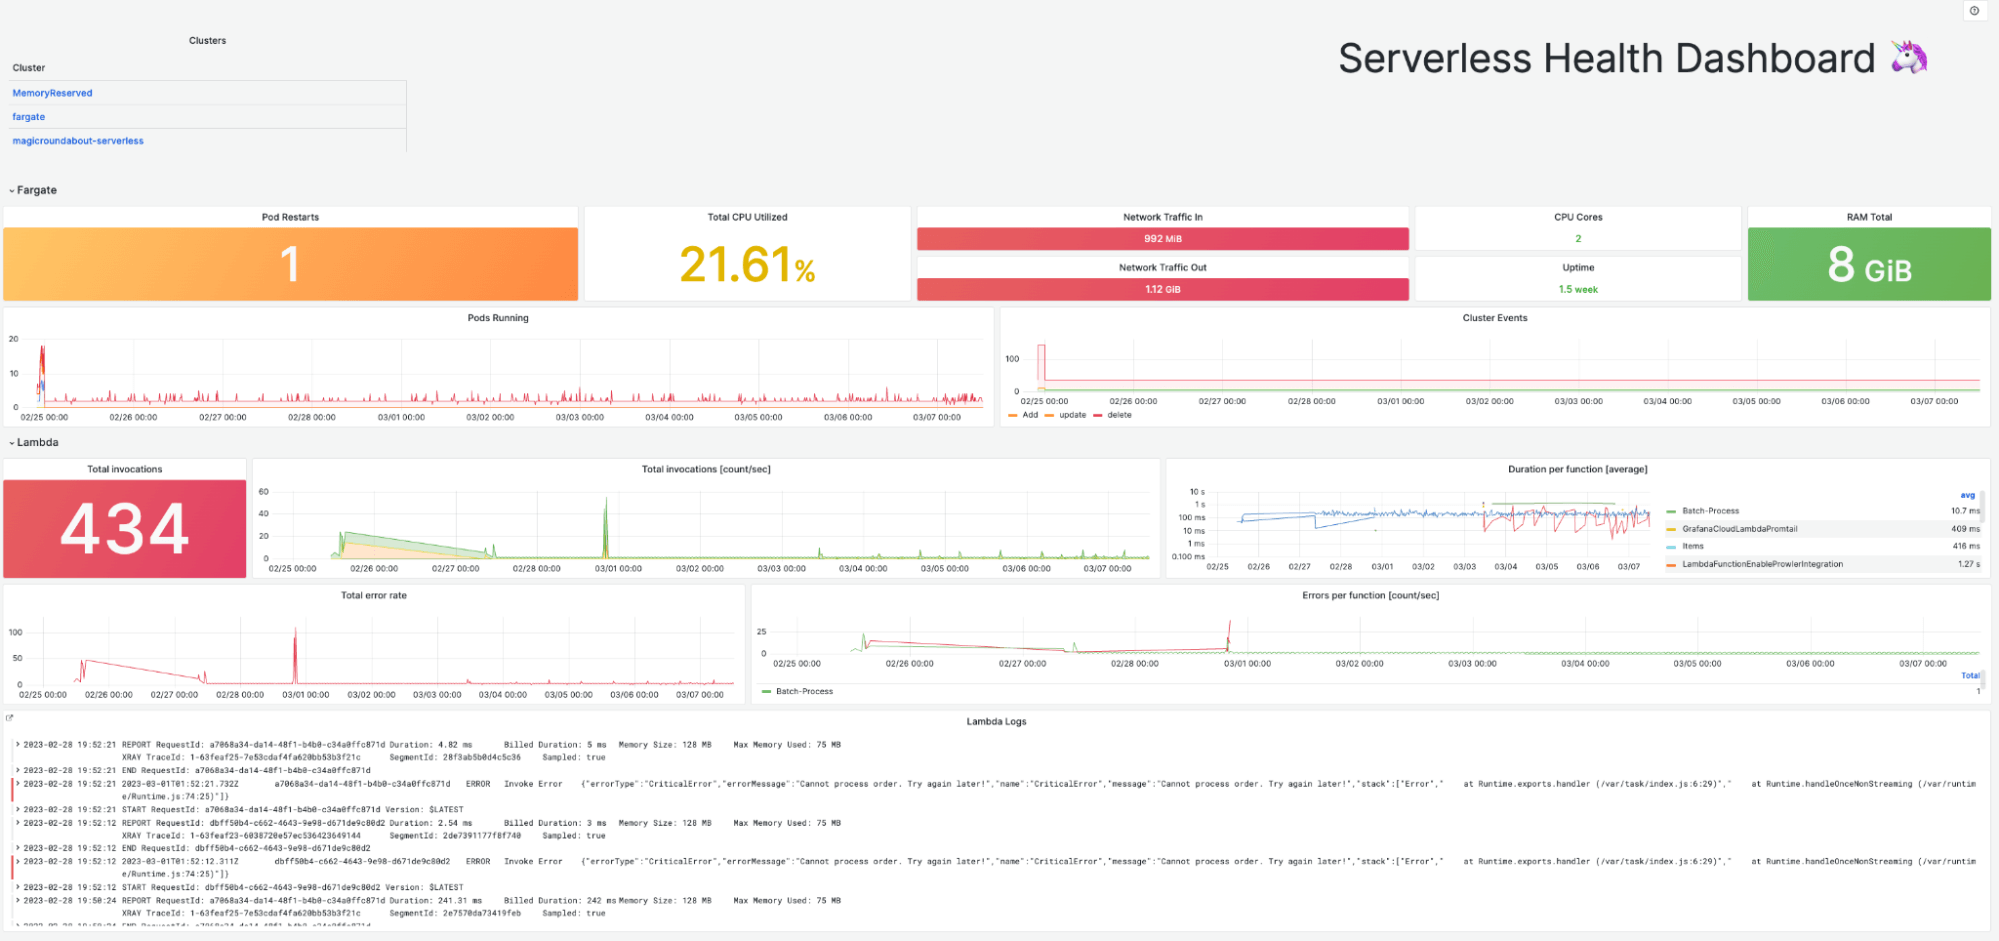
When navigating through this dashboard, users can deep dive into specific Fargate clusters that may be having issues and correlate that data across other serverless services such as Lambda.
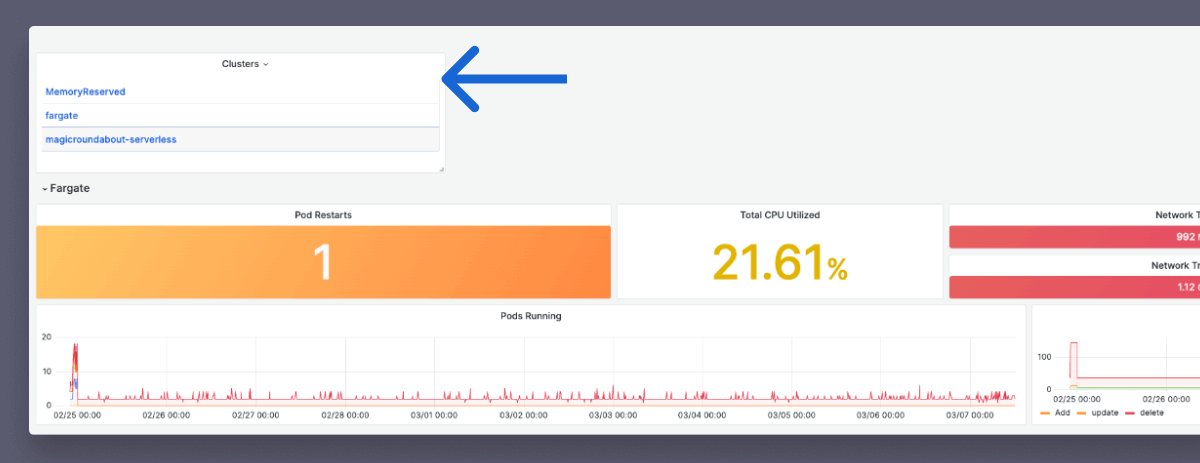
For example, in the dashboard below, users can see which pods in the cluster utilize the most CPU and if the linked Lambda function is impacted. Allowing you to get to the root cause of an issue quicker with a seamless, correlated view of the environment.

To learn more about using Grafana to monitor your serverless environment or ways to take advantage of our interoperability, check out the Grafana Agent documentation and read other stories about how to utilize Grafana’s many integrations.

