New in Grafana Cloud: Key improvements to the command palette and navigation experience
A new navigation experience will be rolled out in Grafana Cloud this month, with improvements designed to make Grafana more seamless to use.
Along with updates in Grafana’s search and navigation, there is a new enhanced command palette that helps streamline workflows and allows you to move through the platform without even taking your hands off the keyboard. By using the command palette and taking advantage of the other new navigation features, you can save time and work more efficiently in Grafana Cloud.
Let’s take a closer look at the enhanced command palette, which Grafana Cloud users will be able to open directly from the header on any page.
Note: The new command palette and navigation experience will become the default in Grafana OSS and Grafana Enterprise with the upcoming Grafana 9.5 release. Until then, you can enable this feature in Grafana OSS and Grafana Enterprise by using the
topnavandtopNavCommandPalettefeature toggles.
What is the command palette?
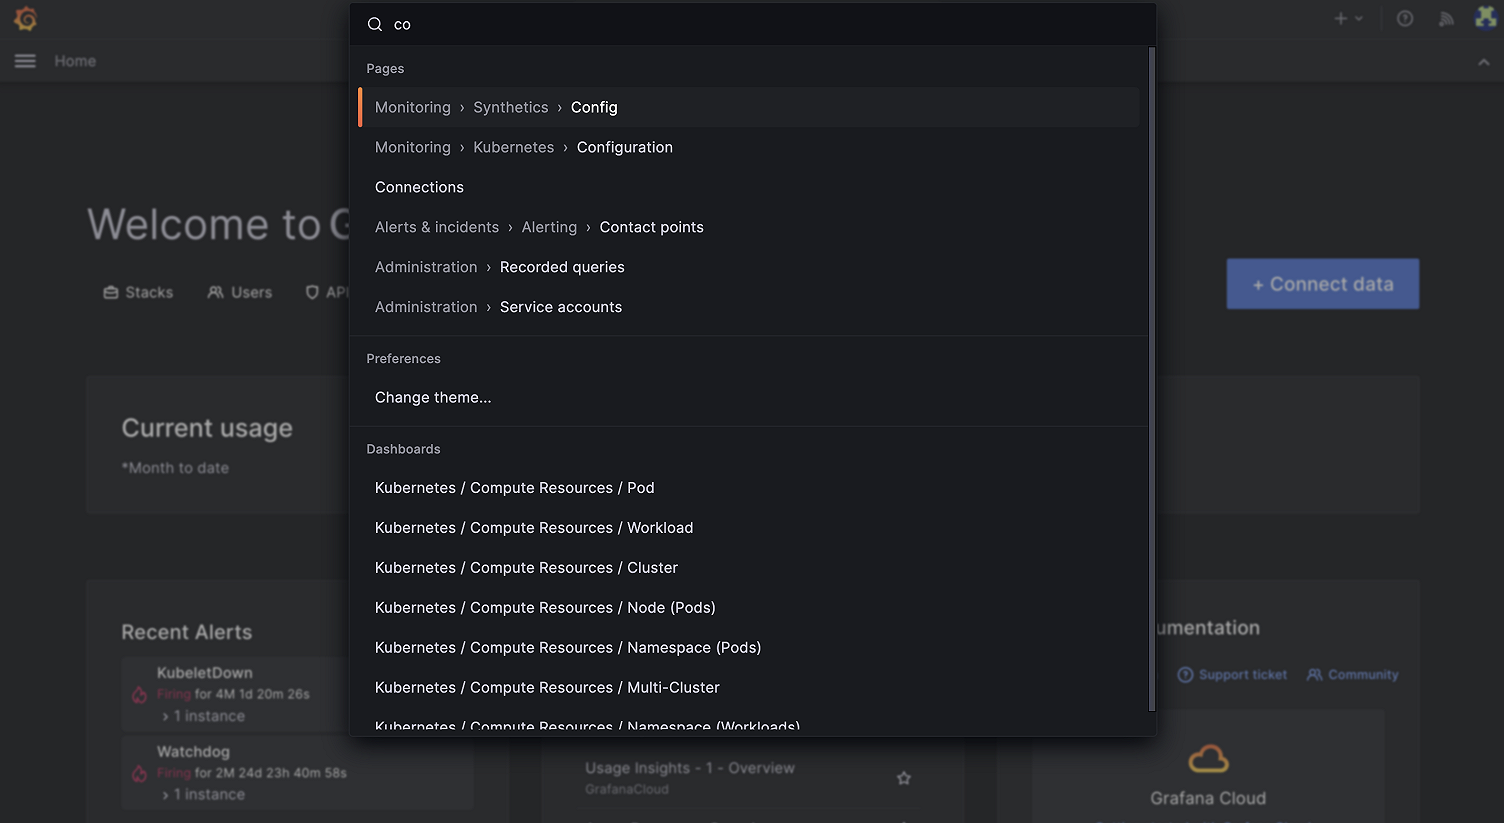
The command palette is a feature that enables you to perform various actions with just a few keystrokes. By using the command palette, you can quickly navigate to different pages and perform tasks in Grafana, all powered by your keyboard. This feature is especially useful for Grafana power users who want to work more efficiently.
Introduced last year in Grafana 9, the command palette can be activated by pressing cmd + k on macOS or ctrl + k on Windows/Linux. You can then start typing to search for the page or task you need to perform. The command palette will automatically display a list of the most relevant results, and you can select the one you want by hitting the enter key.
Key improvements to the command palette
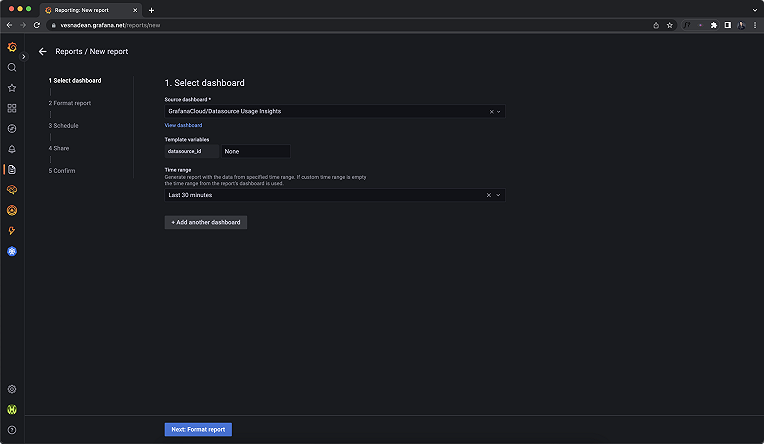
As part of the updates to Grafana’s navigation, we introduced new features and functionalities to the command palette. You can now search for, open, and create dashboards directly from the command palette. In addition, the command palette has been integrated into the header, making it even more accessible and more efficient to use.
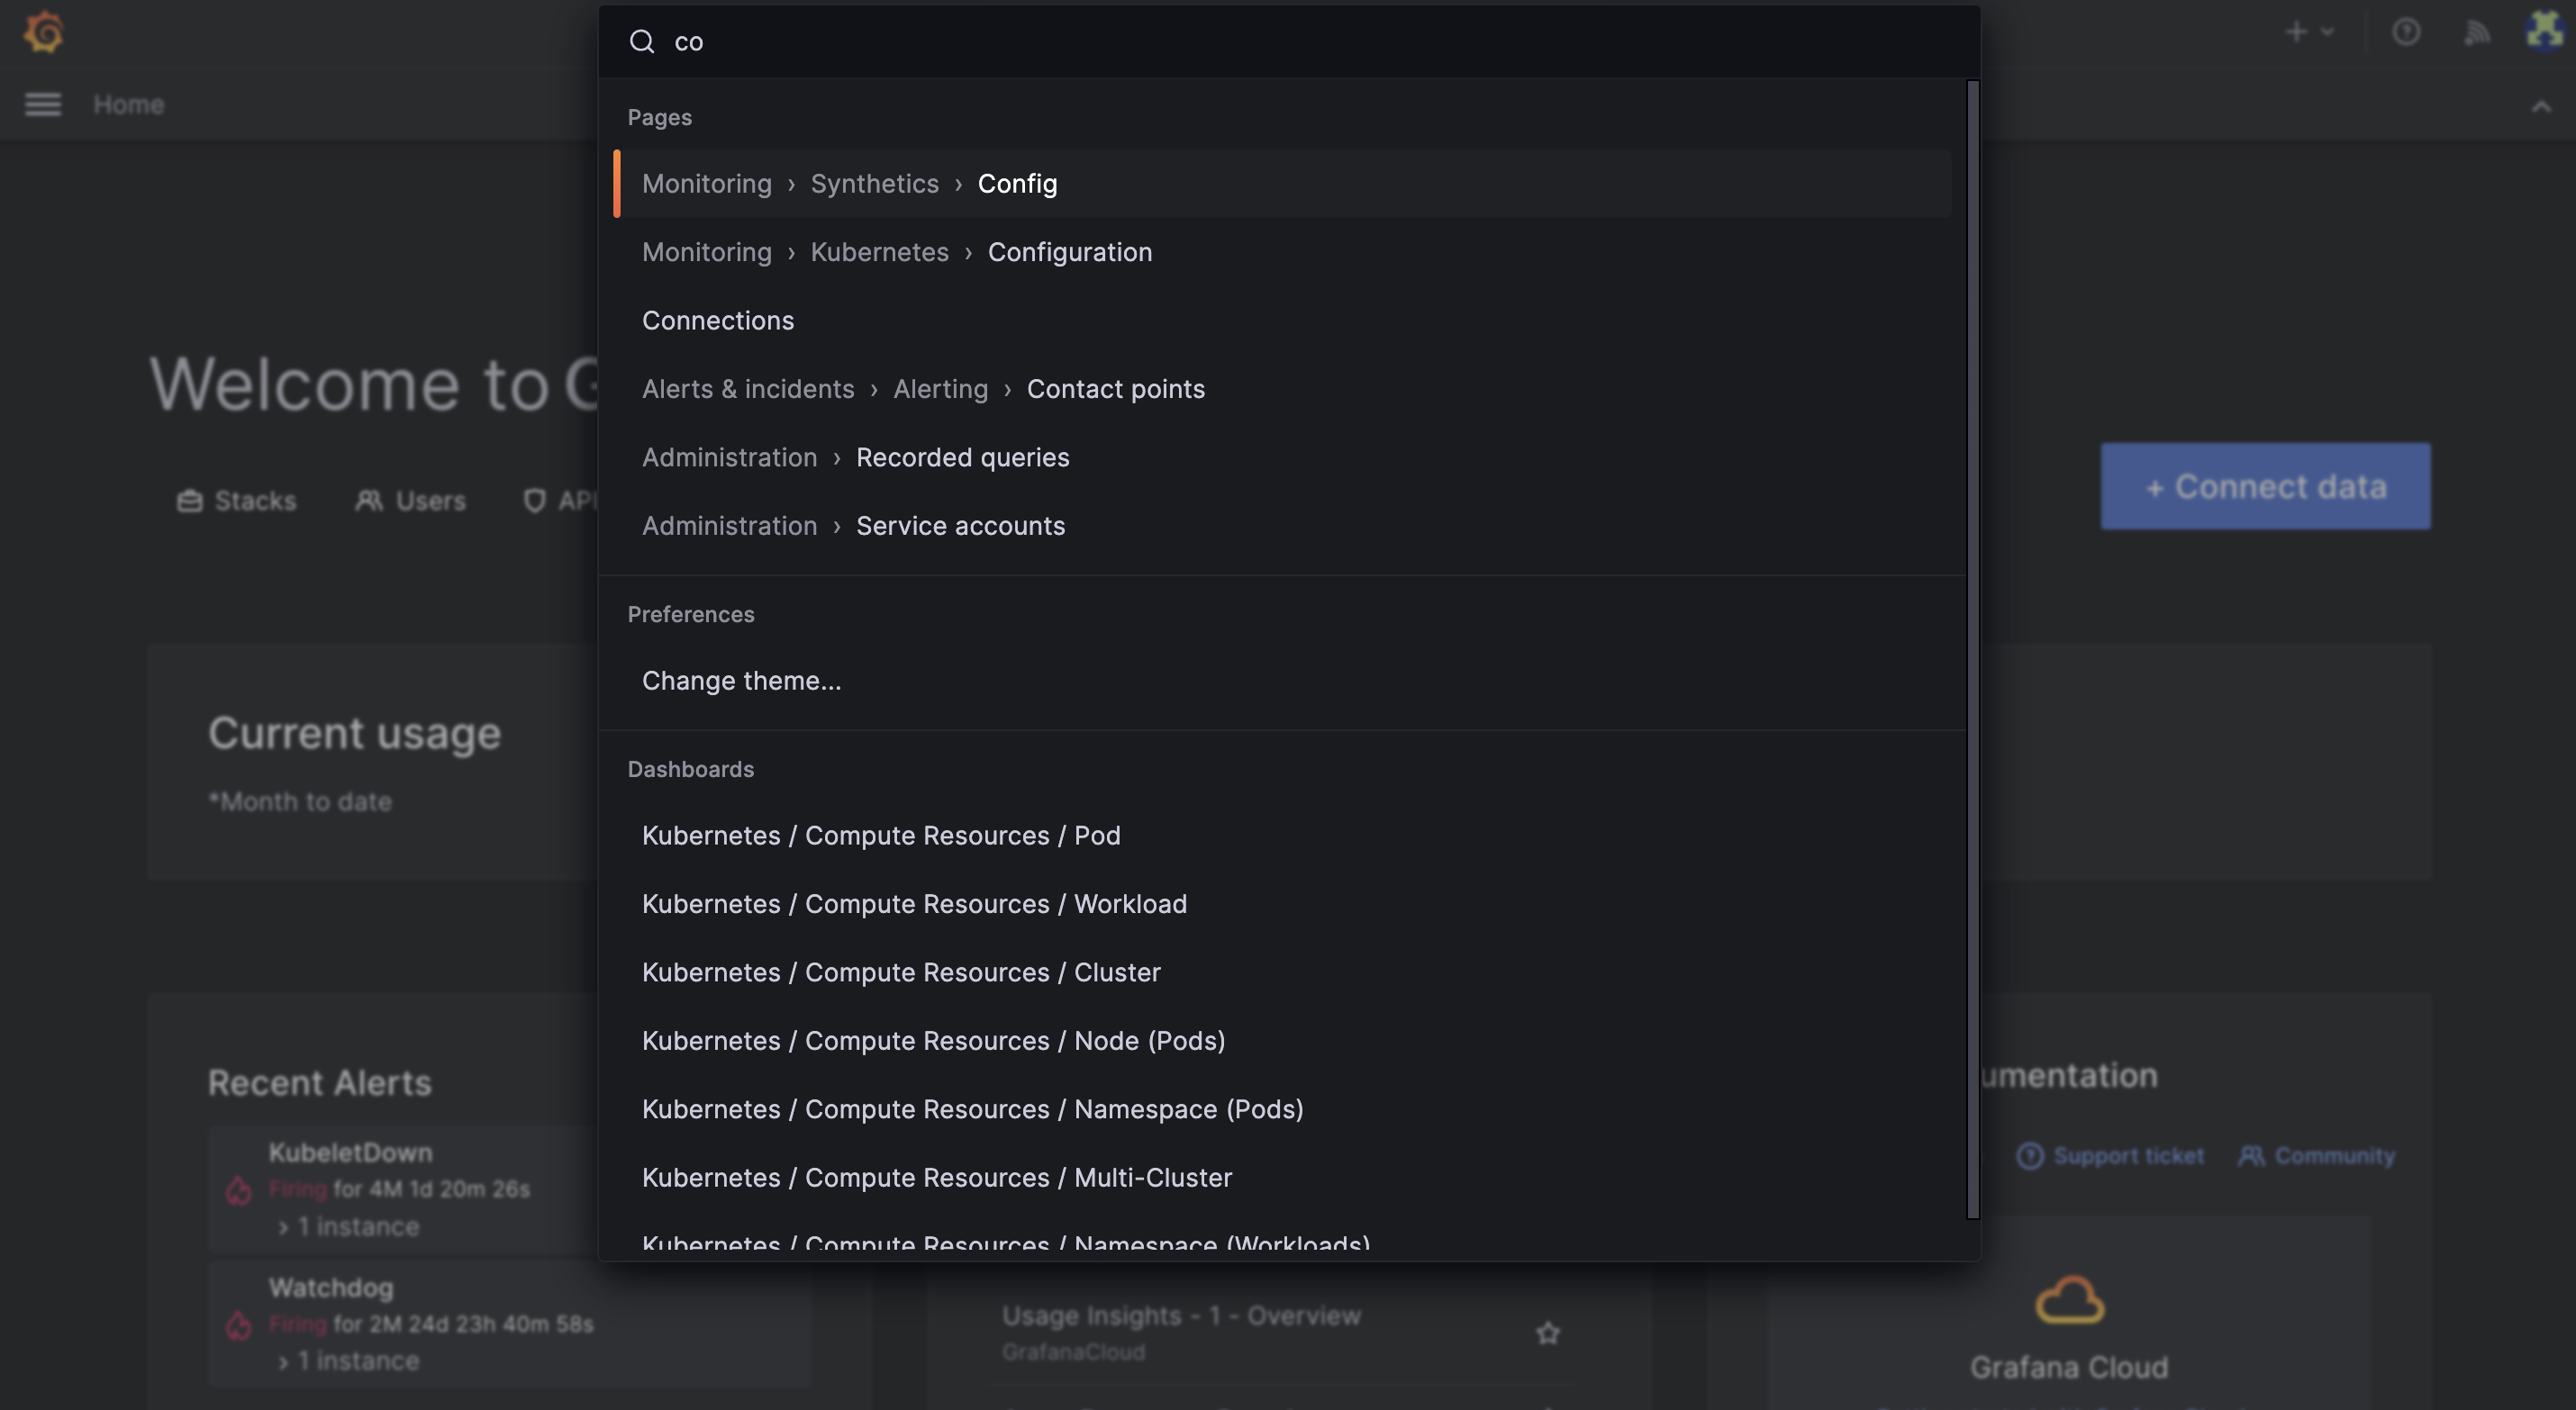
Another new feature of the command palette is that it will display your five most recently viewed dashboards, making it faster to navigate to the pages you use most often.
Overall, using the command palette to navigate Grafana is a time-saver. You can quickly jump to service accounts, alerts, and other frequently used pages by hitting cmd + k, typing the name of the page, and hitting enter.
Learn more about the latest features in Grafana
Get ready to make the most out of your data with Grafana! Learn more about the newest features in the latest Grafana release, including an improved Grafana Loki querying experience and a host of updates to Grafana Alerting to make creating and managing alerts easier.
If you’re not already using Grafana Cloud — the easiest way to get started with observability — sign up now for a free 14-day trial of Grafana Cloud Pro, with unlimited metrics, logs, traces, and users, long-term retention, and access to one Enterprise plugin.