5 key takeaways from the Grafana Labs Observability Survey 2023
Observability is coming into its own, as SREs and DevOps practitioners increasingly seek to centralize the sprawl of tools and data sources to better manage their workloads and respond to incidents faster — and to save time and money in the process.
That was the overarching message from more than 250 observability practitioners who took part in the Grafana Labs’ first ever Observability Survey. It’s clear that the complexity of today’s applications and infrastructure has made organizations of all sizes eager to get more visibility into their systems, which explains the shift from traditional monitoring to modern observability best practices.
“Centralized observability saves other teams from having to build their own monitoring infrastructure,” said one respondent, who works for a large financial services organization.
And despite all the excitement about the progress made so far, there was also plenty of interest in what comes next, with respondents from across the spectrum of adoption eager to see continued growth and maturity in this space.
Takeaways on observability adoption, tools in use, SLOs, and ROI
You can check out all the survey results and analysis by going to the Grafana Labs Observability Survey 2023, but here are the five main takeaways:
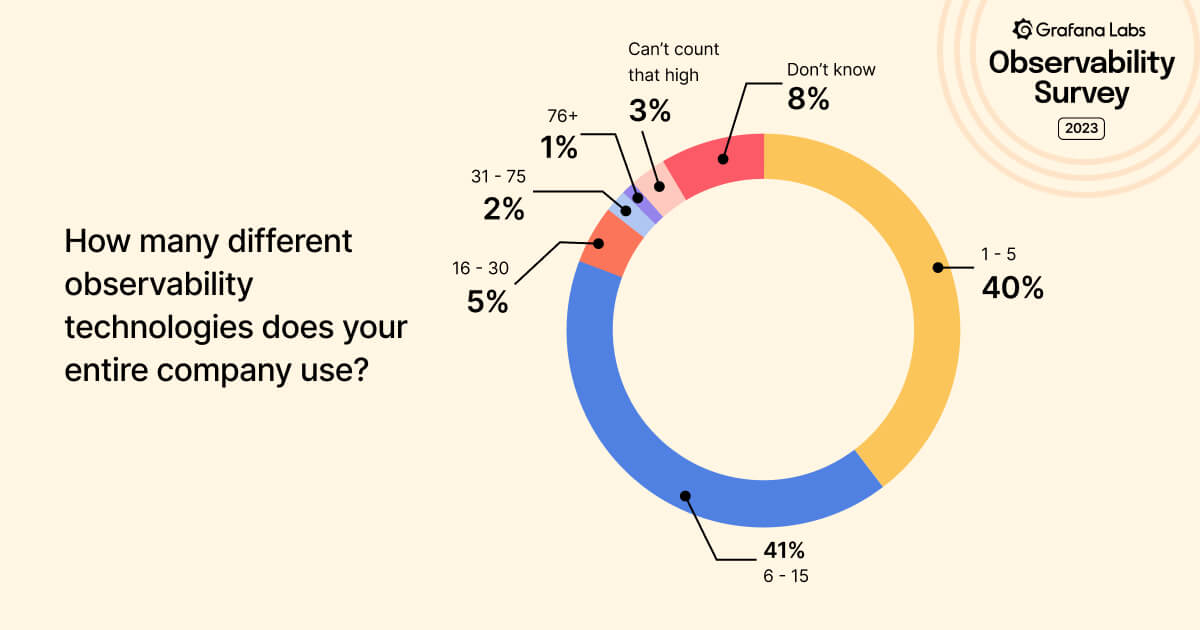
1. Companies are juggling lots of tools and data sources
More than two-thirds of active Grafana users are pulling four or more data sources into Grafana. In addition, most teams, regardless of Grafana usage, are using at least four observability tools, including 20% that use at least seven in their group.
At the company level, those numbers are even higher. Companies are most likely (41%) to have between 6 and 15 tools, but there were also some staggering outliers when asked how many tools were in use — a combined 4% of respondents said their companies had either more than 75 tools or that they simply “can’t count that high.”
2. Organizations are at different stages in their observability journey
Most respondents have centralized observability, but nearly one-third still haven’t. Also, some industries are further along than others. For example, less than half of those in retail or media and entertainment have even reached the point of adopting centralized observability, while 70% of all financial sector companies in the survey have implemented centralized observability and saved time and money as a result.
3. Consolidated observability saves time and money
In total, 70% of respondents said they have centralized observability; among that group, 83% have saved time or money. Many of those who haven’t jumped on board say they are eager to do the same.
4. Accountability and market maturity come to observability
Most companies are either using (28%) or considering (46%) service level indicators (SLIs) or service level objectives (SLOs), and respondents are eager to see the observability market continue to grow and mature. However, there is a spectrum of adoption here as well, with 31% of respondents saying SLOs/SLIs still aren’t on their radars.
Industry and company size also seem to play a role. For example, 40% of companies with more than 5,000 employees are using SLIs/SLOs, compared to only 15% of companies with 10 or fewer employees.
5. Not all ROI is the same
Different organizations have different objectives with their observability strategies. Yes, saving money is the overarching goal, but there are multiple paths to get there, including MTTx improvements, less toil and infrastructure maintenance, better adoption, a consistent developer experience, less complexity, SLOs, better capacity planning, and better alerting and visibility.
A closer look at the survey respondents
The anonymous survey, conducted online between September 2022 and January 2023, was developed by Grafana Labs, and responses were solicited through newsletters, live events, social media, and on the grafana.com website.
Taking a closer look at the participants, they were likely predisposed to open source projects and container-based architectures — 94% use Grafana and 79% use Prometheus. And while survey respondents came from all sorts of industries, from automotive to entertainment to finance, roughly half work in the tech sector. The same goes for company size, with 47% of respondents working at a company with more than 1,000 employees. But we received plenty of responses from individuals who work for companies with as few as 10 employees and as many as 5,000-plus.
After we analyzed the survey data, we wanted to get a fuller picture of users’ observability journeys, so we conducted in-depth interviews with tech leads at six Grafana Labs customers about the impact observability has had at their companies. There were helpful insights that organizations at every stage of the observability journey can relate to. That includes input from a large telecom that has reduced MTTR by more than 40%, improved developer productivity by more than 20%, and cut costs by between 20% and 30%.
Together, the survey data and the in-depth interviews reflect a bullish view of observability – with excitement about the continued growth and maturation of the market. “We have always tried to tie all solutions up in single views. I would say that this approach has led to great reductions in MTTR. But, so far, overhead reduction is slow as the solutions mature,” said one survey respondent from a software and technology organization. “Adoption will pick up the more we invest in and refine [these] solutions.”
To find out more, check out the Grafana Labs 2023 Observability Survey for insights on the state of observability and to see how your organization’s observability practices compare to what your peers are doing.