How to optimize resource utilization with Kubernetes Monitoring for Grafana Cloud
Overprovisioning or underprovisioning your Kubernetes resources can have significant consequences on both your budget and your app performance.
By underprovisioning your Kubernetes infrastructure, you’ll end up with lagging, underperforming, unstable, or non-functional applications. On the opposite end of the spectrum, overprovisioning is a costly issue: Organizations spent almost $500 billion on cloud resources in 2022, yet an estimated 30% of those were wasted.

As investments in the cloud continue to grow, so do the bills, and organizations need to mitigate the threat of an unstable infrastructure and as well as optimize the utilization of their resources in an efficient manner. To help with that, we have introduced resource utilization efficiency in the Grafana Cloud Kubernetes Monitoring solution, which helps to identify and minimize the gap between your resource allocation and your actual resource utilization.
Why resource utilization efficiency matters in Kubernetes
Managing CPU, RAM, and storage in your Kubernetes fleet are some of the keys to success. Assuring that there are enough allocated resources decreases the risk of pod/container eviction and undesired performance issues of your microservices and applications.
Also, unused or stranded resources drain your bank account and increase the cost of your software. You could use an autoscaler to compensate for the imperfections in allocation policies, which continuously “buys” more resources. But how many organizations have an unlimited budget where wastefulness is seen as a good practice?
With resource utilization efficiency in Kubernetes Monitoring, users will be able to easily discover unused and stranded resources, improve pod limits and resource placement, and expose resource management policy imperfections.
By reining in your Kubernetes costs, you give your organization the opportunity to:
- Increase development productivity by opening up the cloud resources to do so.
- Increase testing capacity by allowing for more test environments to be created.
- Increase talent by reallocating saved costs towards building teams.
What are unused resources?
The average percentage of CPU, RAM, and storage that remain untouched for a certain period.
In unused resources, we do not consider momentary peaks in resource usage, which at times can be above expectations. We believe that resource limits are set in your Kubernetes environment as per best practices.
What are stranded resources?
Stranded resources are resources that become unusable due to bad pod placement, e.g. placing too many CPU intensive pods in one node will make a lot of RAM stranded because even if RAM is available and not used, pods will not be assigned as there is insufficient CPU in the node.
Consider the following example:

Above, the team:
- Paid for 10 GB RAM and 10 CPU (5 per node per resource type)
- Needed 8 GB RAM and 9 CPU
- Used 5 GB RAM and 8 CPU
- Still had their pod evicted
What are resource limits?
The Kubernetes configuration that will provide minimum and maximum resource constraints for a pod or container.
Note: It’s important to ensure that resource limits are configured in order to unlock the full suite of features offered by the K8s Monitoring solution.
How to find resource inefficiencies with Kubernetes Monitoring
In the Kubernetes Monitoring solution, it’s easier to discover the cause of Kubernetes resource inefficiencies with out-of-the-box tools provided in Grafana Cloud.
The Cluster overview page gives you a bird’s eye view of your resource management policies.
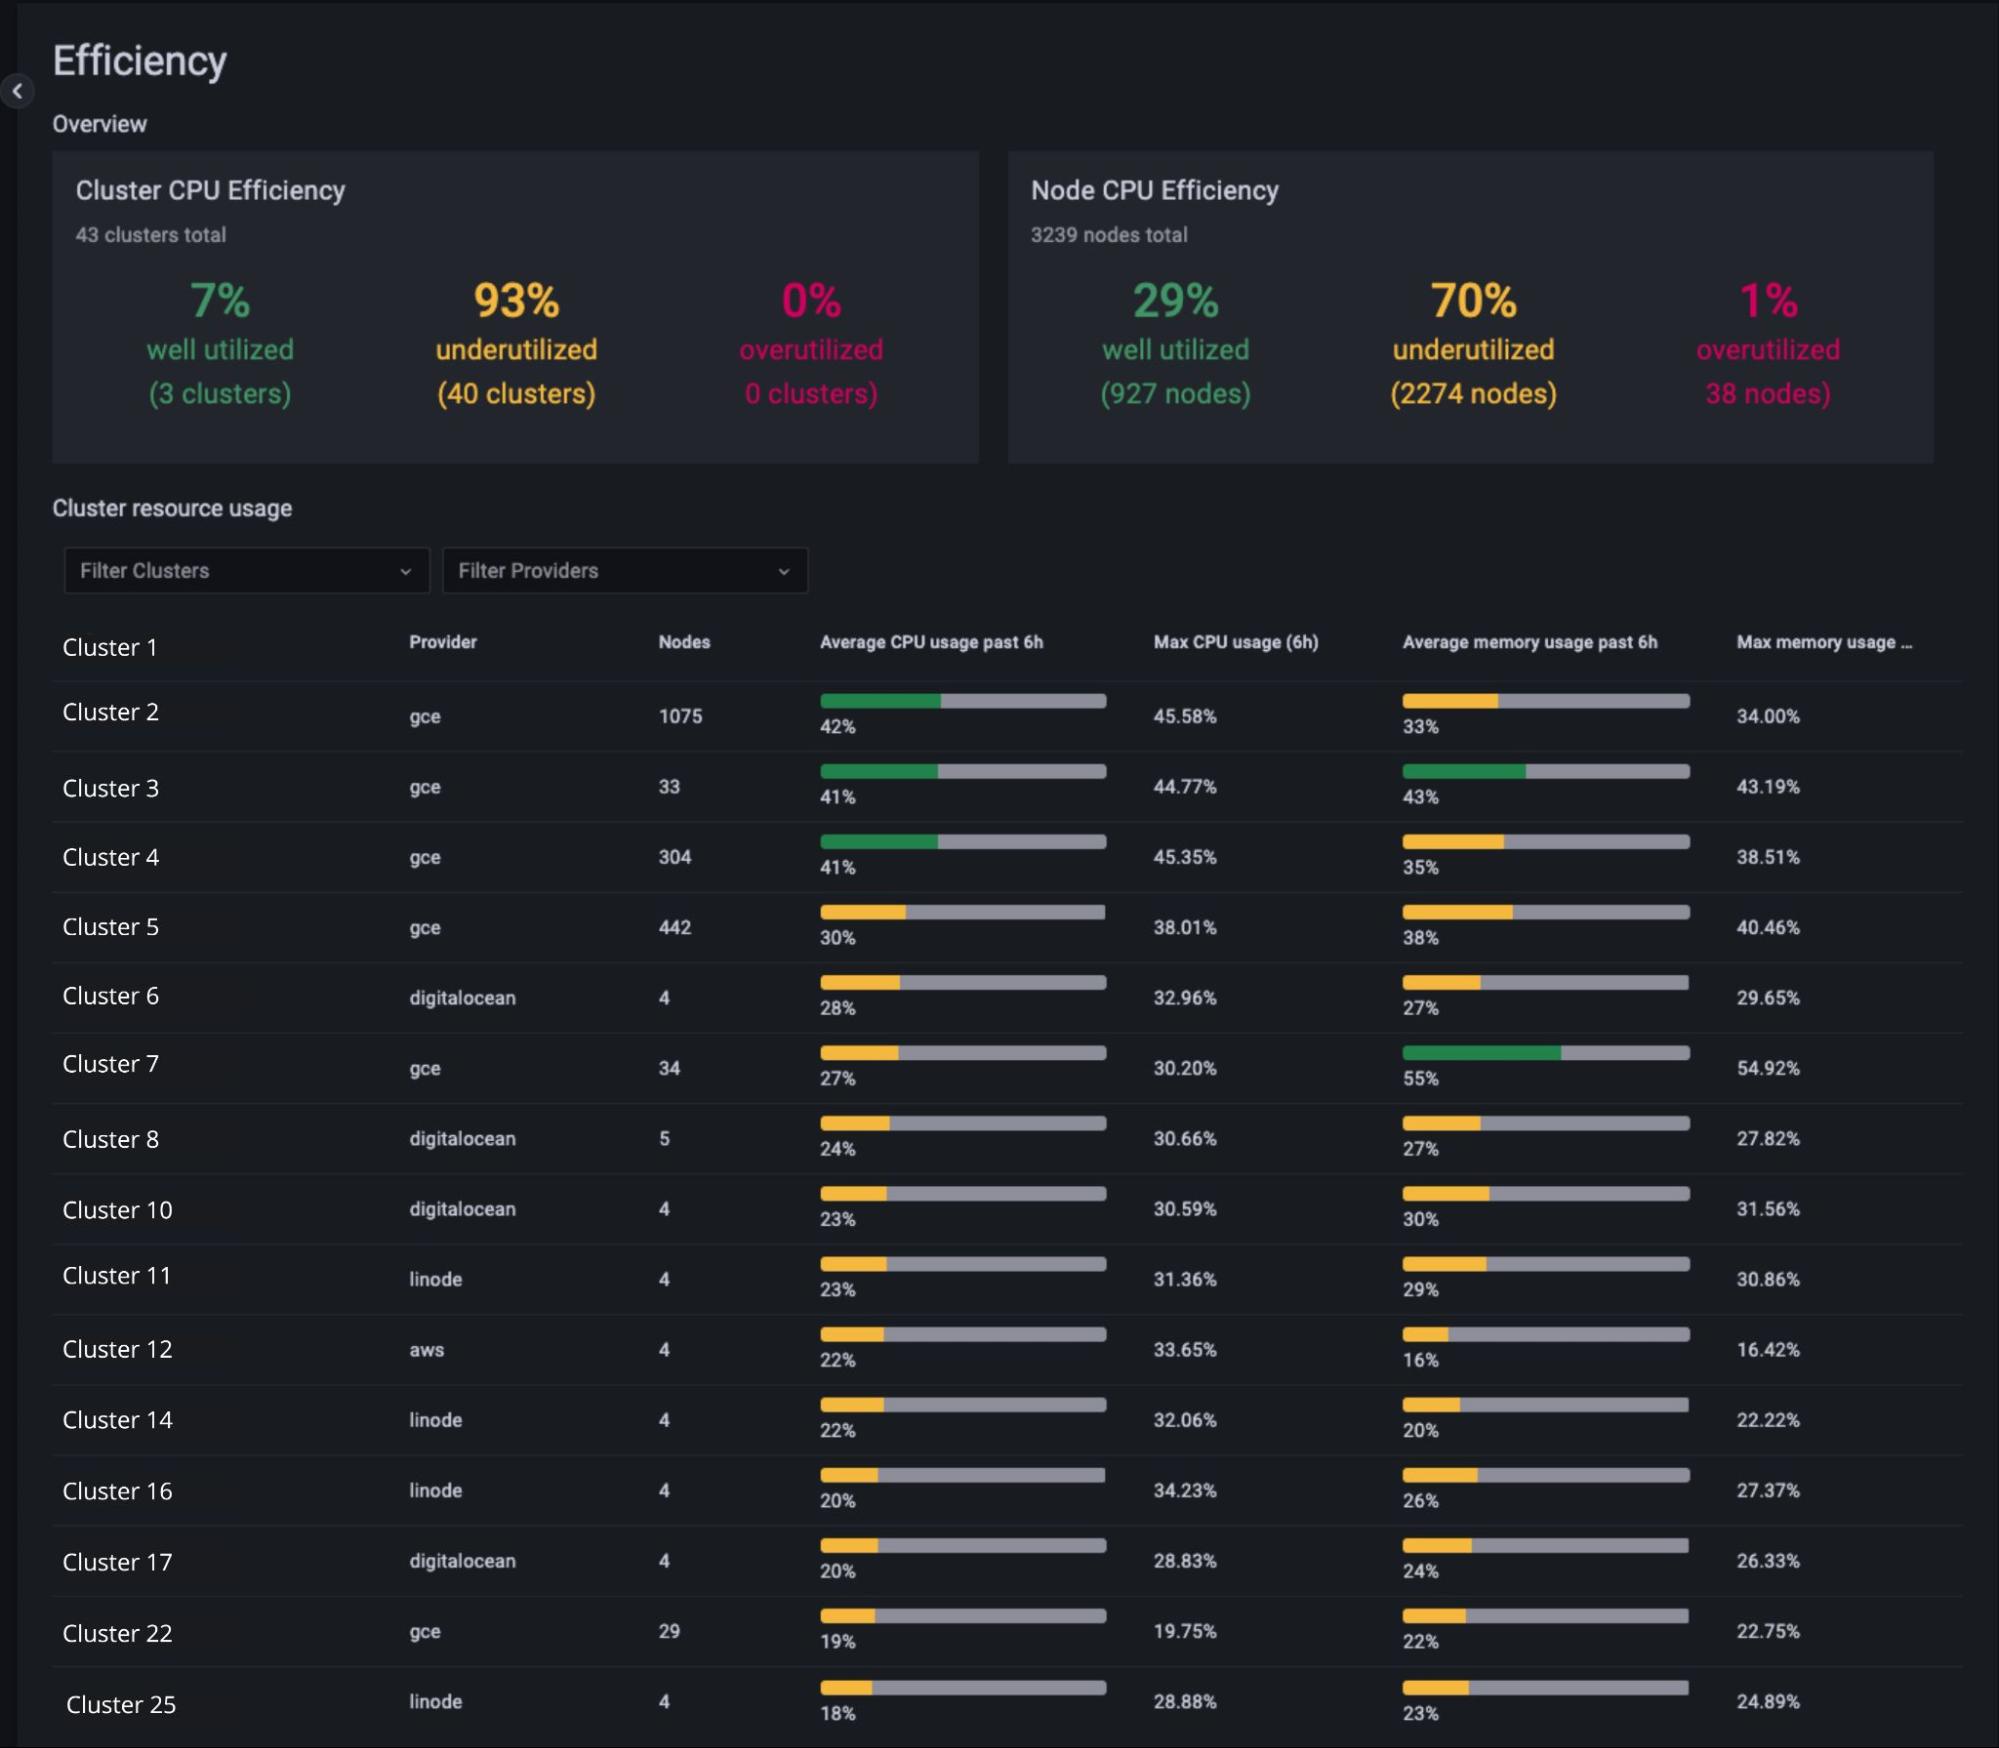
The Deployment and Pod landing pages provide you with a deep dive into your Kubernetes fleet to understand resource usage peaks.
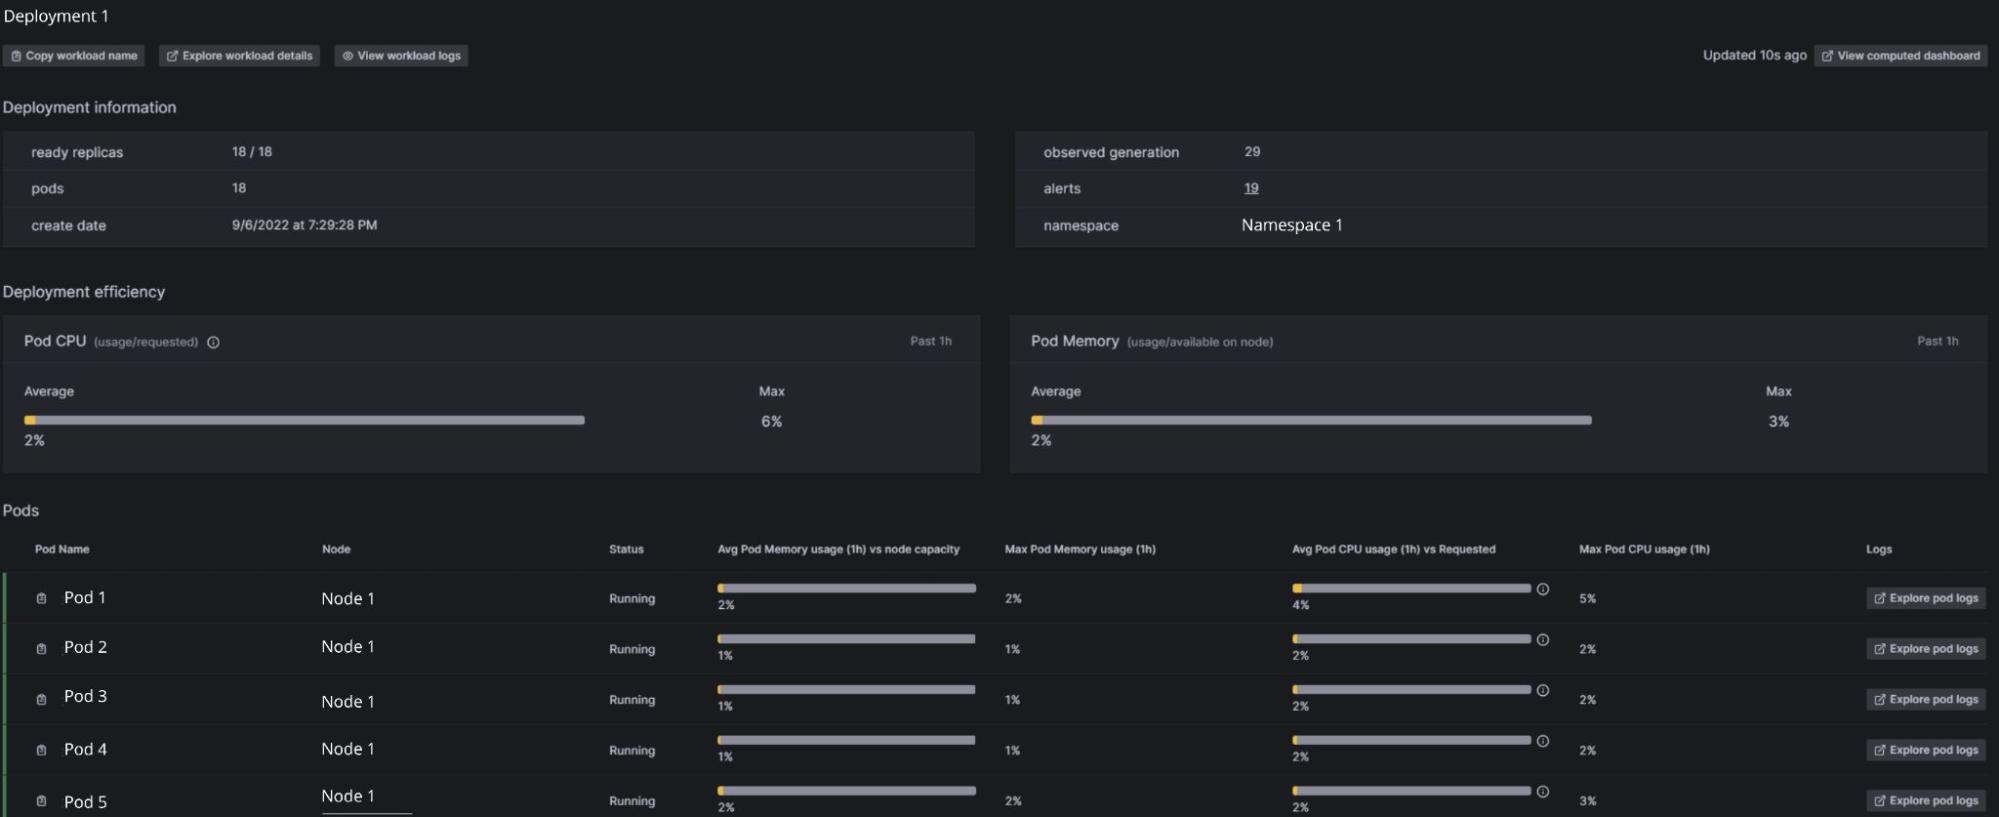
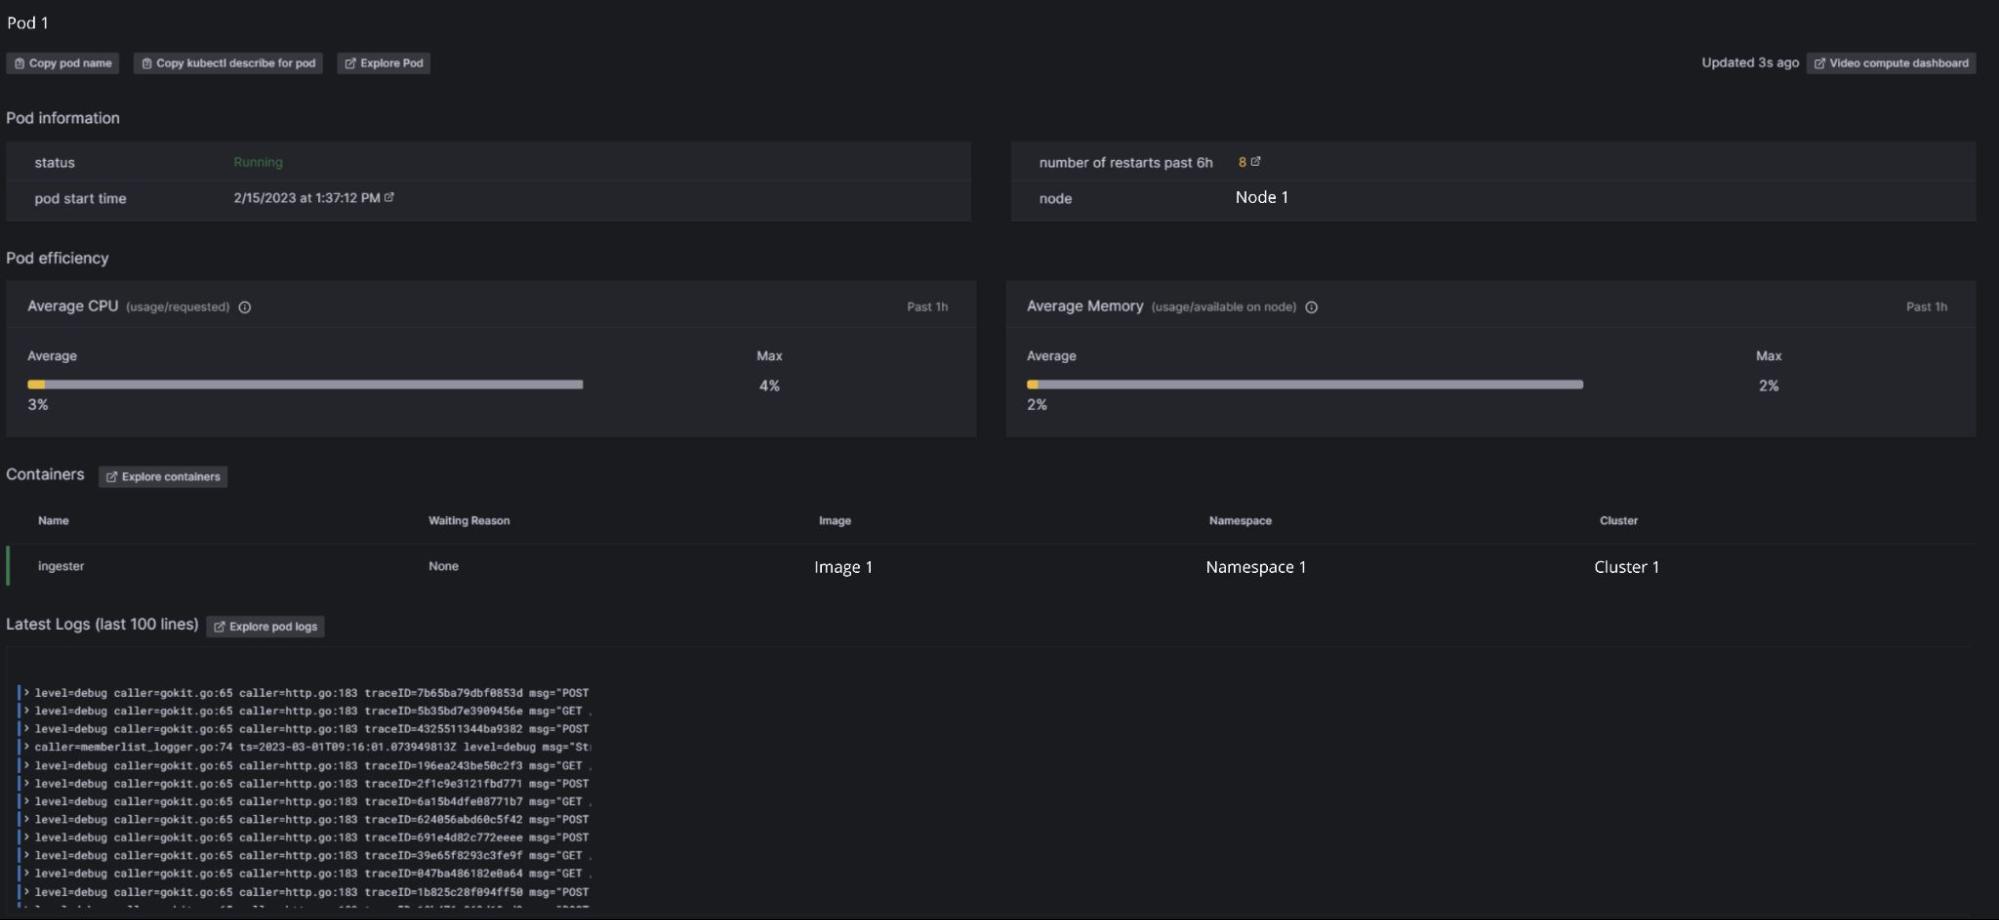
Within each of the overviews, there are thresholds we have embedded into the resource utilization efficiency feature:
- Green means your resource usage is just right: Resource utilization is between 60 and 90%.
- Yellow means overprovisioned: Resource utilization is below 60%, indicating these are resources that you don’t use but still pay for.
- Red means underprovisioned: Resource utilization is over 90%, signaling possible performance issues.
How Kubernetes Monitoring solves resource utilization problems
- Avoid performance degradation by correlating data between average and peak resource usage

It is ideal that that the average resource usage of your cluster remains fairly stable. However, in certain time windows, you can receive complaints from your users that the application that they are using has sluggish performance.
One scenario that may be playing out is that you have a peak in the cluster’s resource usage. Here is where the 6h Max CPU and Memory indicator comes into play. It gives you a North Star for troubleshooting and defining the root cause of the issues that your users are facing.
- Raise awareness and accountability for your resource utilization

Having insights about the per cluster and per cloud provider resource utilization gives you the opportunity to raise accountability and awareness within your teams and organization.
If your organization manages multiple clusters and cloud providers, it needs to make well-informed decisions around its infrastructure resource utilization. This is the only way that it can:
- Improve performance
- Increase stability
- Optimize cost
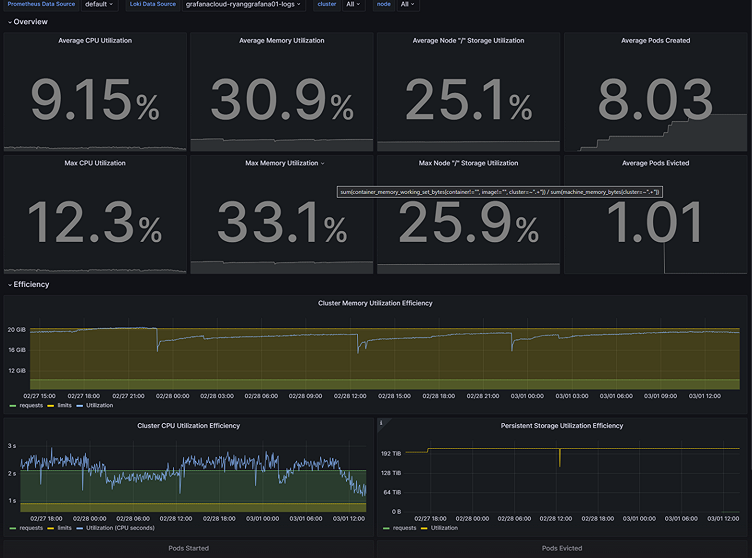
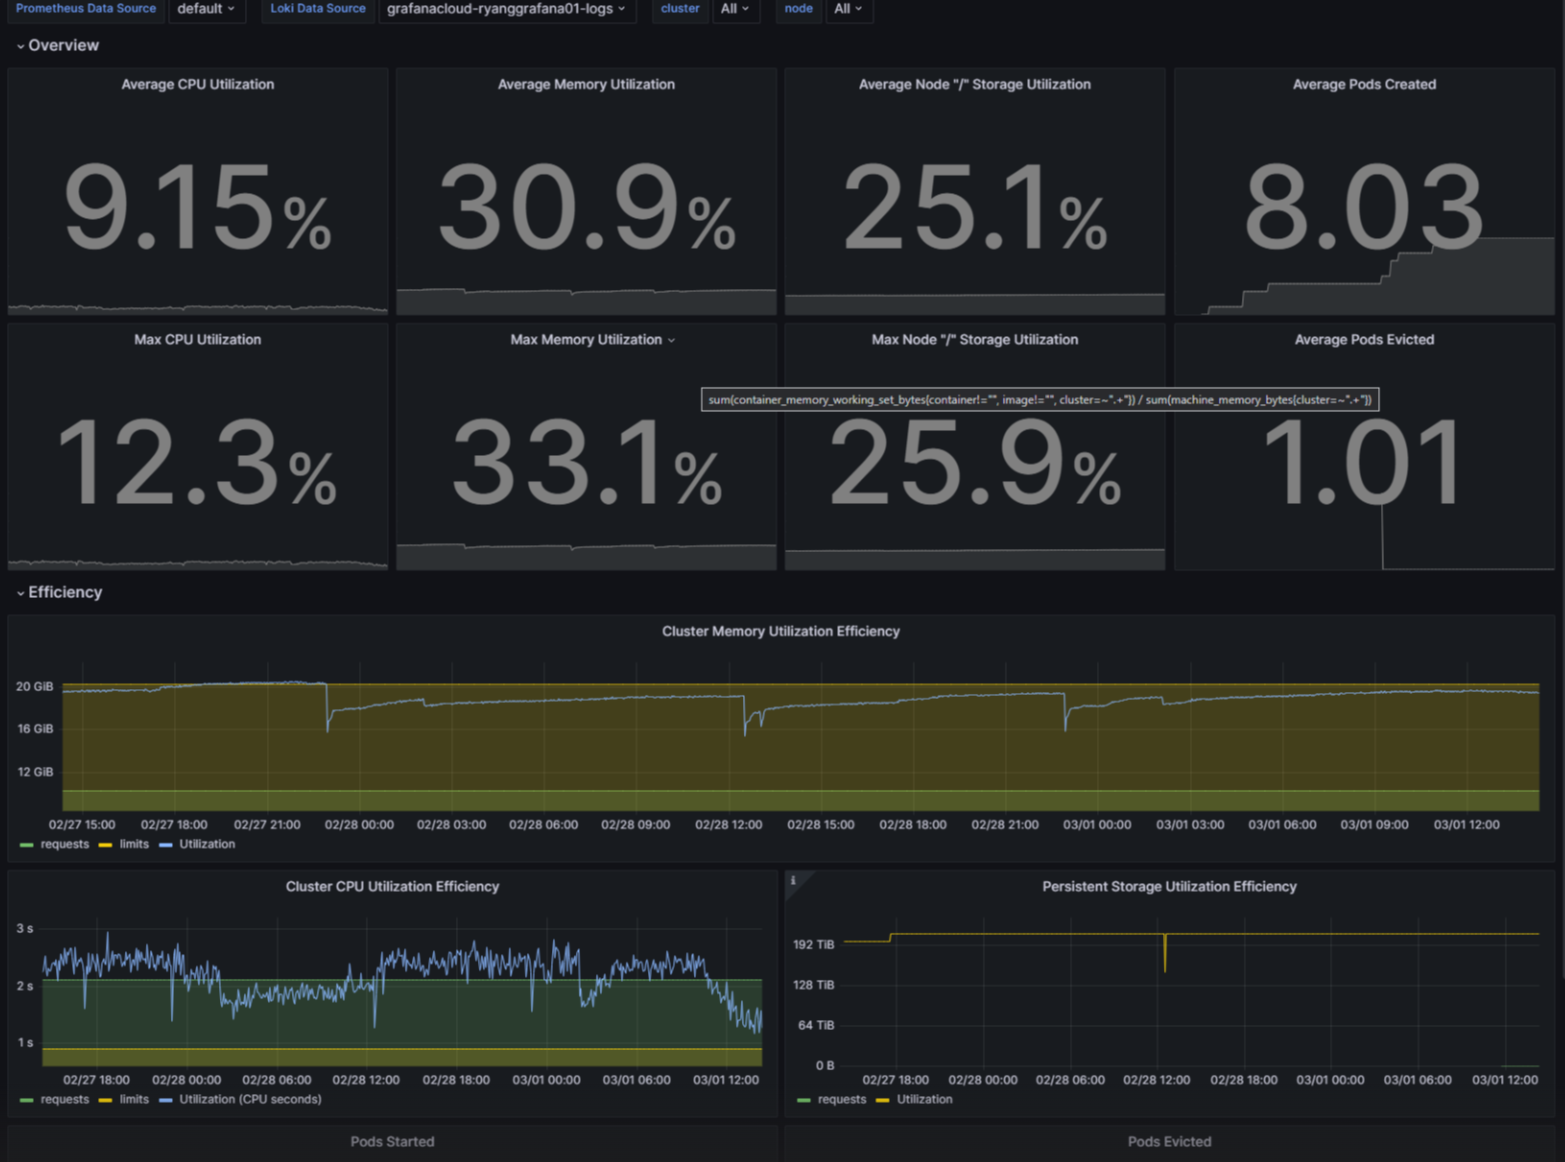
In Kubernetes Monitoring, there is also an out-of-the-box dashboard that shows you the most valuable efficiency signals, such as:
- Created vs. evicted pods to indicate pod placement issues and node sizing improvements
- Average vs. maximum CPU, memory, and storage trends to help you resolve performance issues with one click
Learn more about Kubernetes Monitoring in Grafana Cloud
To learn more about resource utilization efficiency in the Grafana Cloud, check out our Kubernetes Monitoring documentation or visit our Kubernetes Monitoring solutions page.
If you’re not already using Grafana Cloud — the easiest way to get started with Kubernetes Monitoring — sign up now for a free 14-day trial of Grafana Cloud Pro, with unlimited metrics, logs, traces, and users, long-term retention, and access to one Enterprise plugin.

