Grafana Labs webinars: Reduce MTTR, build beautiful Grafana dashboards, and more
With Grafana Labs’ live and on-demand webinars, you have the option to learn Grafana whenever you want, wherever you are.
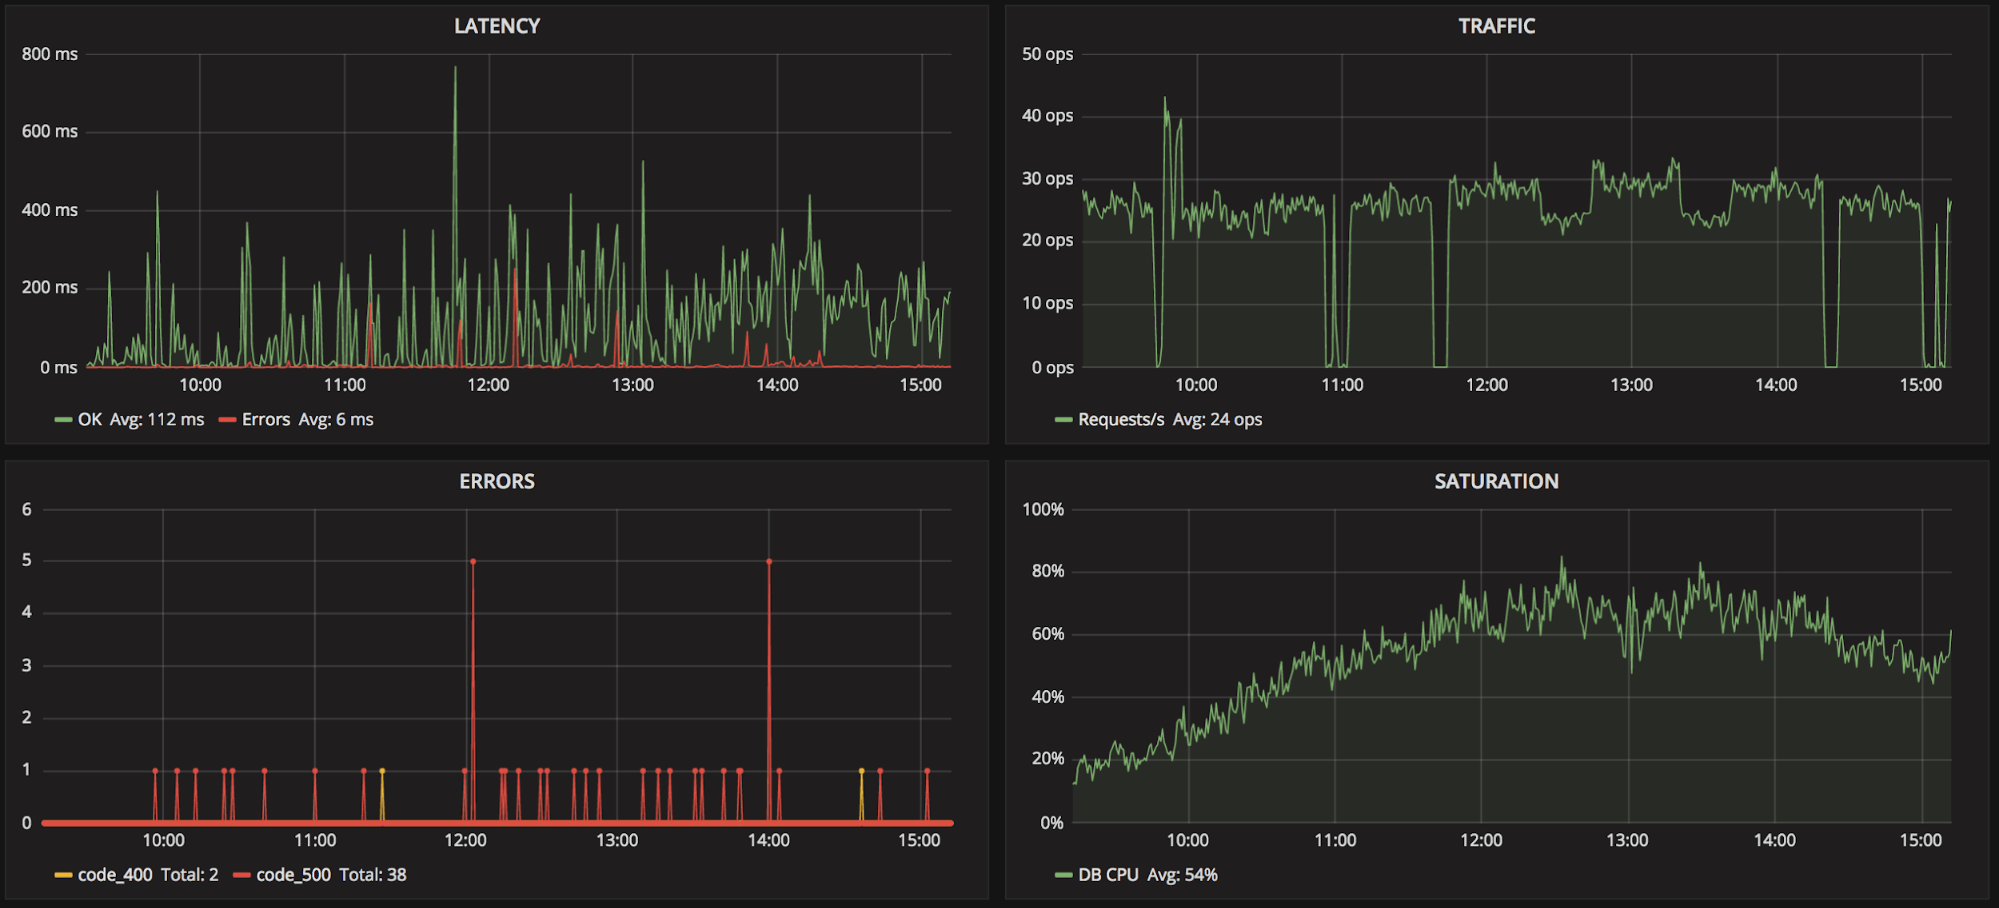
This February, we focused on the core building blocks of the Grafana LGTM Stack (Loki for logs, Grafana for visualization, Tempo for traces, Mimir for metrics), including how to approach dashboard design, visualizing and unifying your data with plugins, and reducing your mean time to both identify and resolve (MTTI/MTTR) any issues that may arise.
Here’s a look at the on-demand sessions you may have missed in February — and the upcoming webinars you can register for right now.
Reduce MTTR with the Grafana LGTM Stack and on-call management
Our webinar on how to reduce resolution time (MTTR) with the Grafana LGTM Stack and on-call management is a great complement to our January cost-optimization webinar on how to reduce your observability TCO (total cost of ownership).
In the MTTR webinar, Grafana Labs Senior Solutions Engineer Lionel Marks performed a couple of live demos using the Grafana LGTM Stack, including Grafana OnCall. He showed how you can use Grafana to help identify issues faster, as well as how to incorporate alerting and incident response and management to resolve those issues faster. He also went over how to work with enterprise plugins, which allow you to correlate disparate data sources right in Grafana.

Unify your data with Grafana plugins: Datadog, Splunk, MongoDB, and more
If our mention of using plugins to connect disparate data sources piqued your interest, well we have another webinar for you! Grafana Labs Senior Solutions Engineer Willie Engelbrecht walked through how to unify your data with Grafana plugins including Datadog, Splunk, MongoDB, and more. This webinar is a deeper dive into Grafana’s robust plugins ecosystem, with real-time demos and answers to the audience’s questions on best practices for connecting a variety of data sources.

Visualizing Microsoft Azure with Grafana
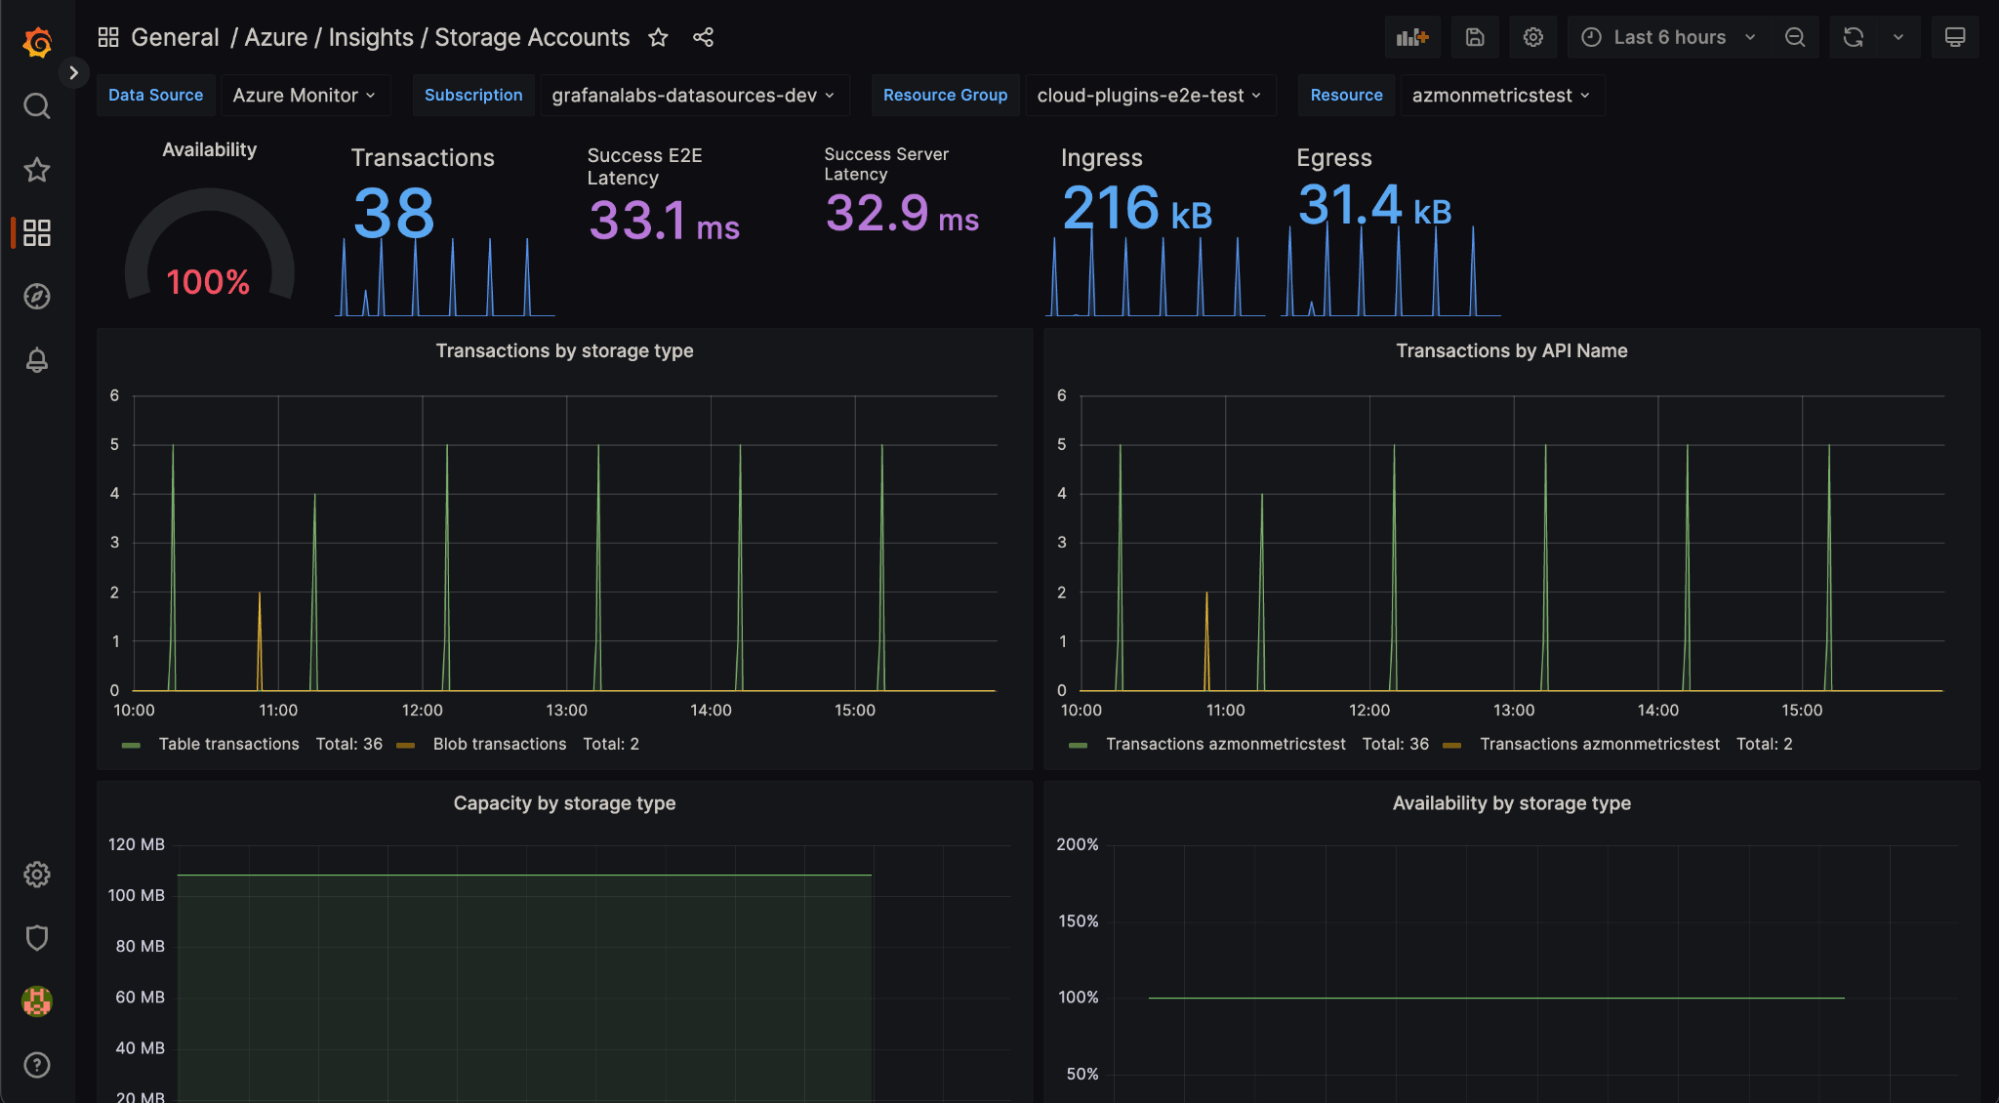
We took an even deeper dive into plugins with our webinar on how to visualize Microsoft Azure workloads in Grafana. Software engineers Andreas Christou and Adam Simpson walked through using the open source Azure Monitor plugin to visualize Azure data using Grafana dashboards.

Getting started with Grafana dashboard design
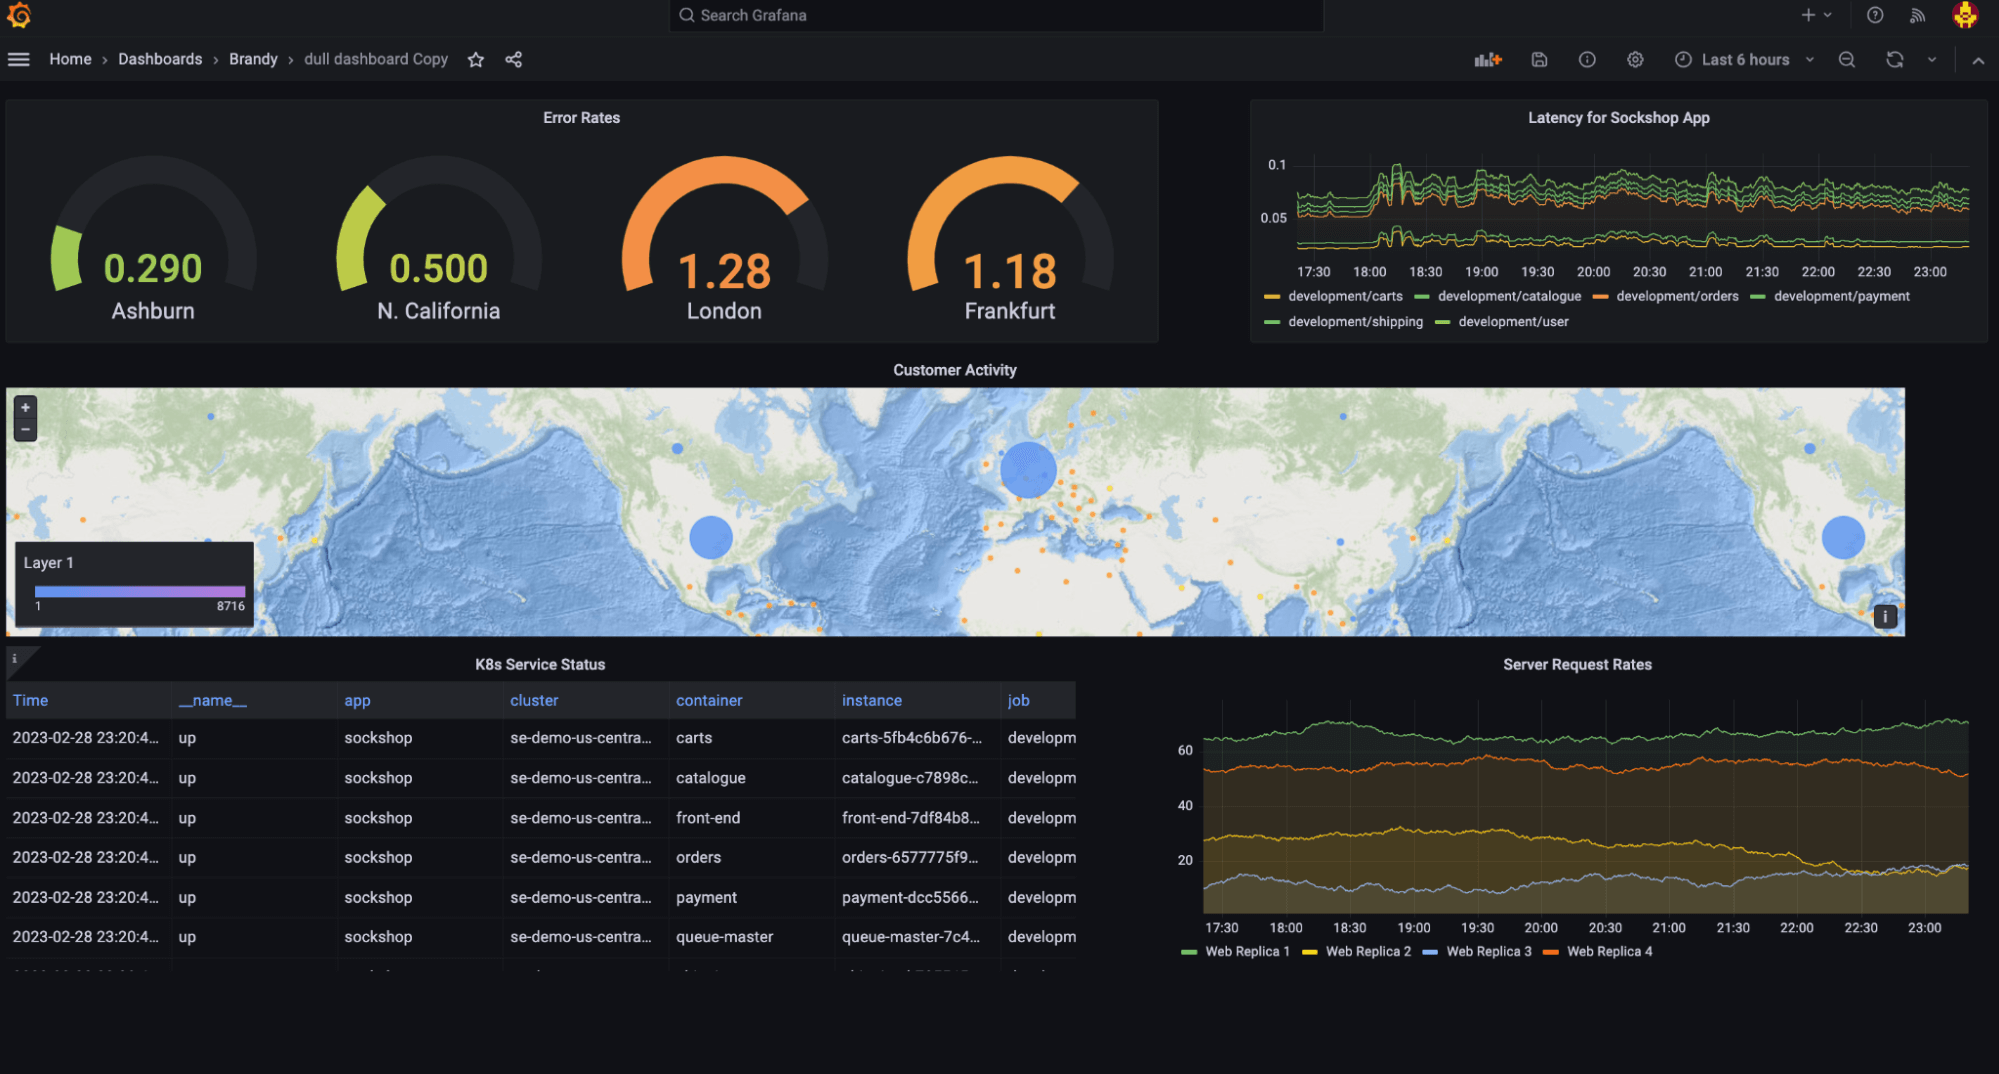
While understanding how to connect disparate sources in order to correlate your data and reduce MTTI/MTTR is helpful, your dashboard is where it all comes together. Grafana Labs Senior Solutions Engineer Brandy Smith walked through how to get started with Grafana dashboard design, including considerations (e.g., target audience, visual hierarchies, and accessibility), alignment, size, colors, shapes, and more. This webinar ends with a real-time GeoMap dashboard makeover.

Grafana webinars: Coming soon …
In the coming months, we have webinars dedicated to popular topics such as getting started and scaling with the Grafana LGTM Stack, an introduction to metrics, another run of basic dashboard consideration, and of course more plugins! Here’s the latest lineup:
Visualizing Google Cloud with Grafana
March 7 | 09:30 PST, 18:30 CET, 17:30 UTC
Check out the open source Google Cloud Monitoring (formerly Stackdriver) plugin and learn how to visualize your Google Cloud data using Grafana dashboards.Getting started with the Grafana LGTM Stack
March 22 | 09:30 PDT, 12:30 EDT, 16:30 UTC
Learn how our open and composable Grafana LGTM Stack can serve as your centralized observability platform using our single-pane-of-glass approach.Scaling and securing your Prometheus metrics in Grafana
March 30 | 11:00 PDT, 14:00 EDT, 18:00 UTC
We’ll cover how Grafana Enterprise Metrics (GEM) can be a great solution for providing a unified view of your Prometheus metrics, for both real-time and historical analysis.Scaling your observability with the Grafana LGTM Stack
April 5 | 09:30 PDT, 12:30 EDT, 16:30 UTC
In this 30-minute demo, we’ll show you how to go from zero to observability in just a few minutes with the Grafana Enterprise Stack.Intro to metrics with Grafana: Prometheus, Grafana Mimir, Graphite, and beyond
April 11 | 10:00 PDT, 13:00 EDT, 17:00 UTC
Learn about the challenges when scaling metrics systems, with a particular focus on Prometheus, Grafana Mimir, and Graphite.Getting started with Grafana dashboard design
April 13 | 10:00 CEST, 13:30 IST, 08:00 UTC
Find out more about how to best determine your audience and context in order to build dashboards with purpose.Unify your data with Grafana plugins: Datadog, Splunk, MongoDB, and more
April 25 | 09:30 PDT, 12:30 EDT, 16:30 UTC
Learn how to leverage our robust plugin ecosystem in order to visualize data and perform analytics on disparate data sources.
Check out our Webinars page for a full list of on-demand sessions and upcoming live webinars.
