Visualize real-time mobile app data with the Embrace data source plugin for Grafana
Chakshu Mehta is a principal product marketer at Embrace, helping to build and execute on go-to-market strategy for their category-defining experience engineering solution for mobile. She has a decade of experience creating launch and messaging strategy for various B2B startups and enterprise solutions across industries including sales tech, application security and DevOps.
Customers choose Embrace to help mobile development teams build fantastic mobile app experiences. Embrace provides best-in-class mobile insights that help users prioritize, understand, and resolve issues. All of which leads to better development decisions.
But in modern software engineering, no team exists in a vacuum. Building amazing user experiences often requires that you analyze a wider set of data in collaboration with specialized teams (like server-side application teams, business intelligence, data science, or product analytics), many of whom might have different data sources and platforms they use. Grafana is ubiquitous across most companies delivering great open source software, used by millions of engineers worldwide for observability to reliably operate their apps, services, and infrastructure. So when we thought about how we could build an out-of-the-box experience for our customers to combine data from multiple places, Grafana was a natural fit.
Today, we’re excited to introduce the new Embrace data source plugin for Grafana. Now mobile teams have an easy way to visualize and analyze Embrace mobile golden signal metrics directly in Grafana, and get a real-time, end-to-end view into their mobile app health and performance alongside any number of Grafana’s 300+ plugins.
Why Embrace + Grafana?
By using Embrace with Grafana, mobile engineers can now share key golden signals in real time with SRE, DevOps, and platform engineers to eliminate blind spots from missing mobile data and truly gain full-stack visibility into their end user’s experience across the frontend, backend, and everything in between.
Teams can seamlessly correlate Embrace mobile metrics alongside their existing data in Grafana, such as relevant logs, infrastructure health metrics, and other telemetry from their app’s dependencies. With end-to-end visibility, teams can improve cross-team collaboration, identify issues, and get to the root cause faster, ultimately improving the end user experience.
By integrating the Embrace plugin, companies building incredible mobile experiences can take advantage of the rich Grafana ecosystem of query, dashboarding, and visualization tools to resolve common problems, such as:
1. Adding mobile golden signals to existing operational dashboards to get an end-to-end view of key services and customer-facing app behavior
When you add the Embrace plugin, it configures an Embrace API data source that you can use for panels in other dashboards with mixed data sources. This means you can understand the immediate impact of your mobile crash rates and many other golden signals (with more coming soon!) alongside backend service or infrastructure health metrics all in the same dashboard.
Let’s say your auth service starts failing. Your Ops teams and on-call engineers now can understand the impact to crash rates, error rates, or other key metrics, with more data coming soon! Not only does this mean more accurate impact analysis, but when the issue is resolved, you can confirm recovery on the app.

To add a new metric panel, add a new panel and select Embrace Metrics API as the data source. The Embrace Metrics API is queried using PromQL, so you can write your queries or perform operations using this query language.
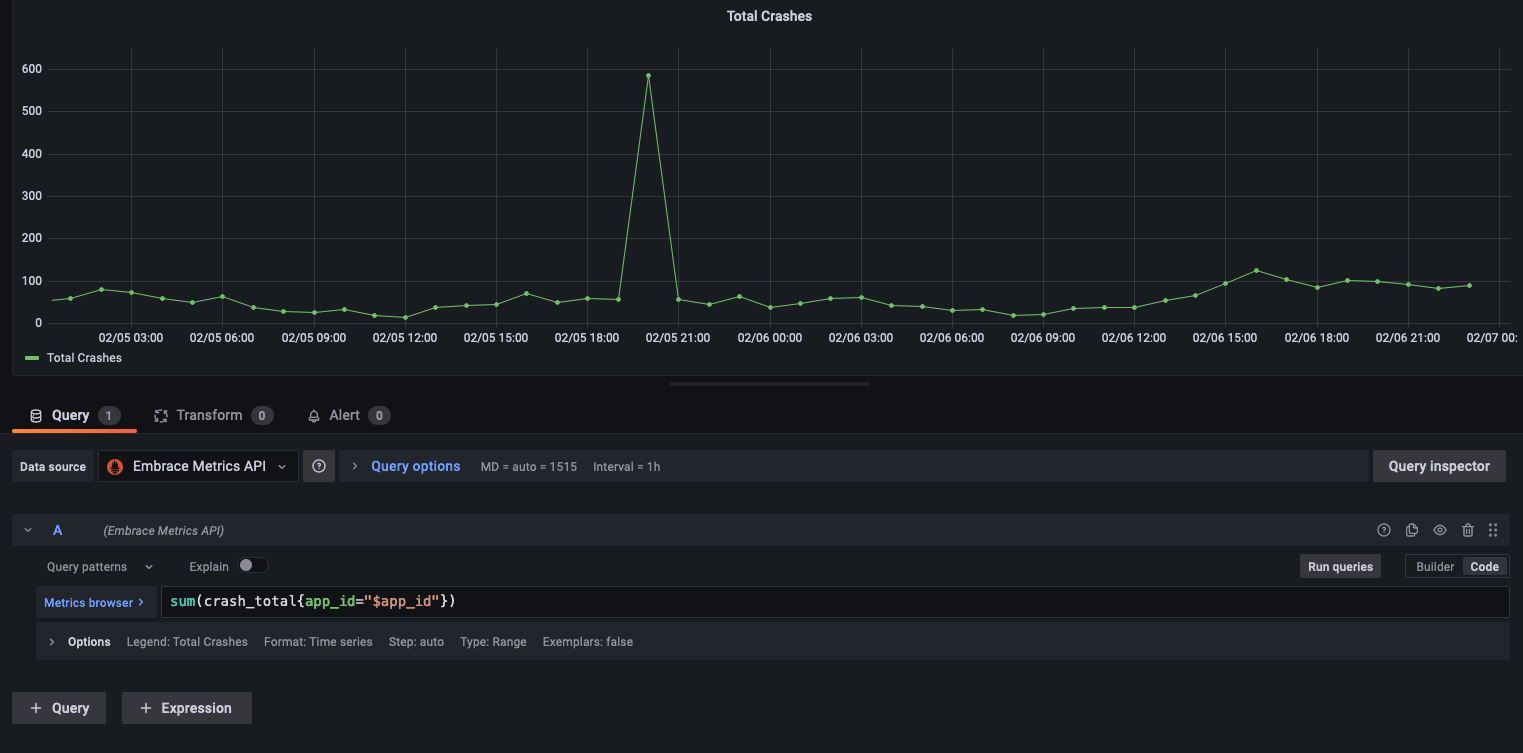
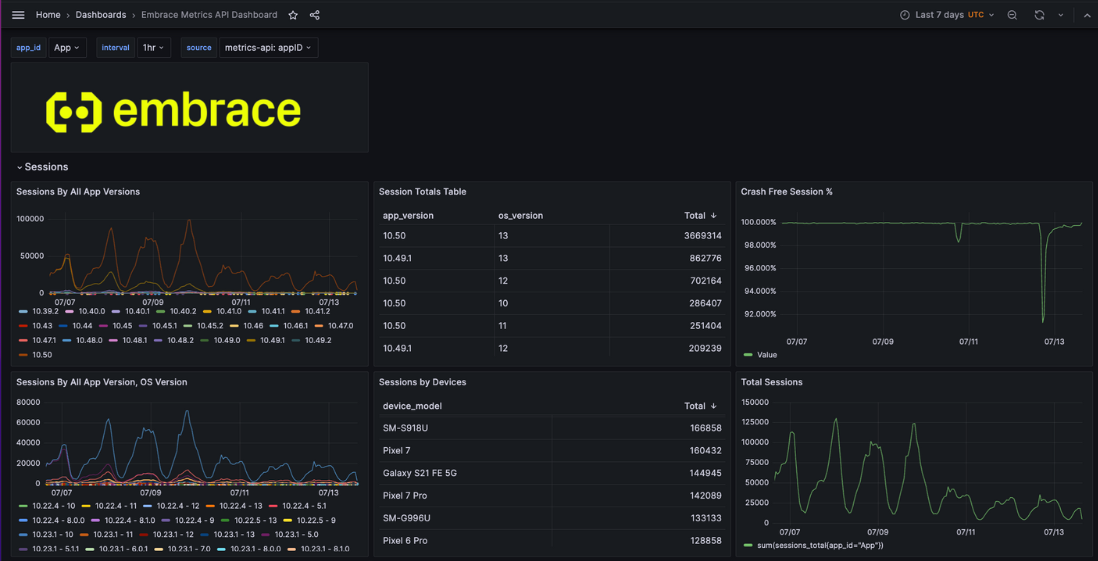
2. Getting an out-of-the-box Grafana dashboard for mobile golden signals — without sending other teams to Embrace
The Embrace plugin includes a suite of app health and performance widgets in an out-of-the-box Embrace Metrics API dashboard that visualizes key crash metrics and KPIs for a given time span. Metrics that are packaged into the plugin with prebuilt dashboards include:
- Percentage of crash-free sessions
- Total number of crashes
- User impact metrics and percentages
- App version adoption
We’re adding new metrics to our API every day, so more granularity and metrics are coming soon!
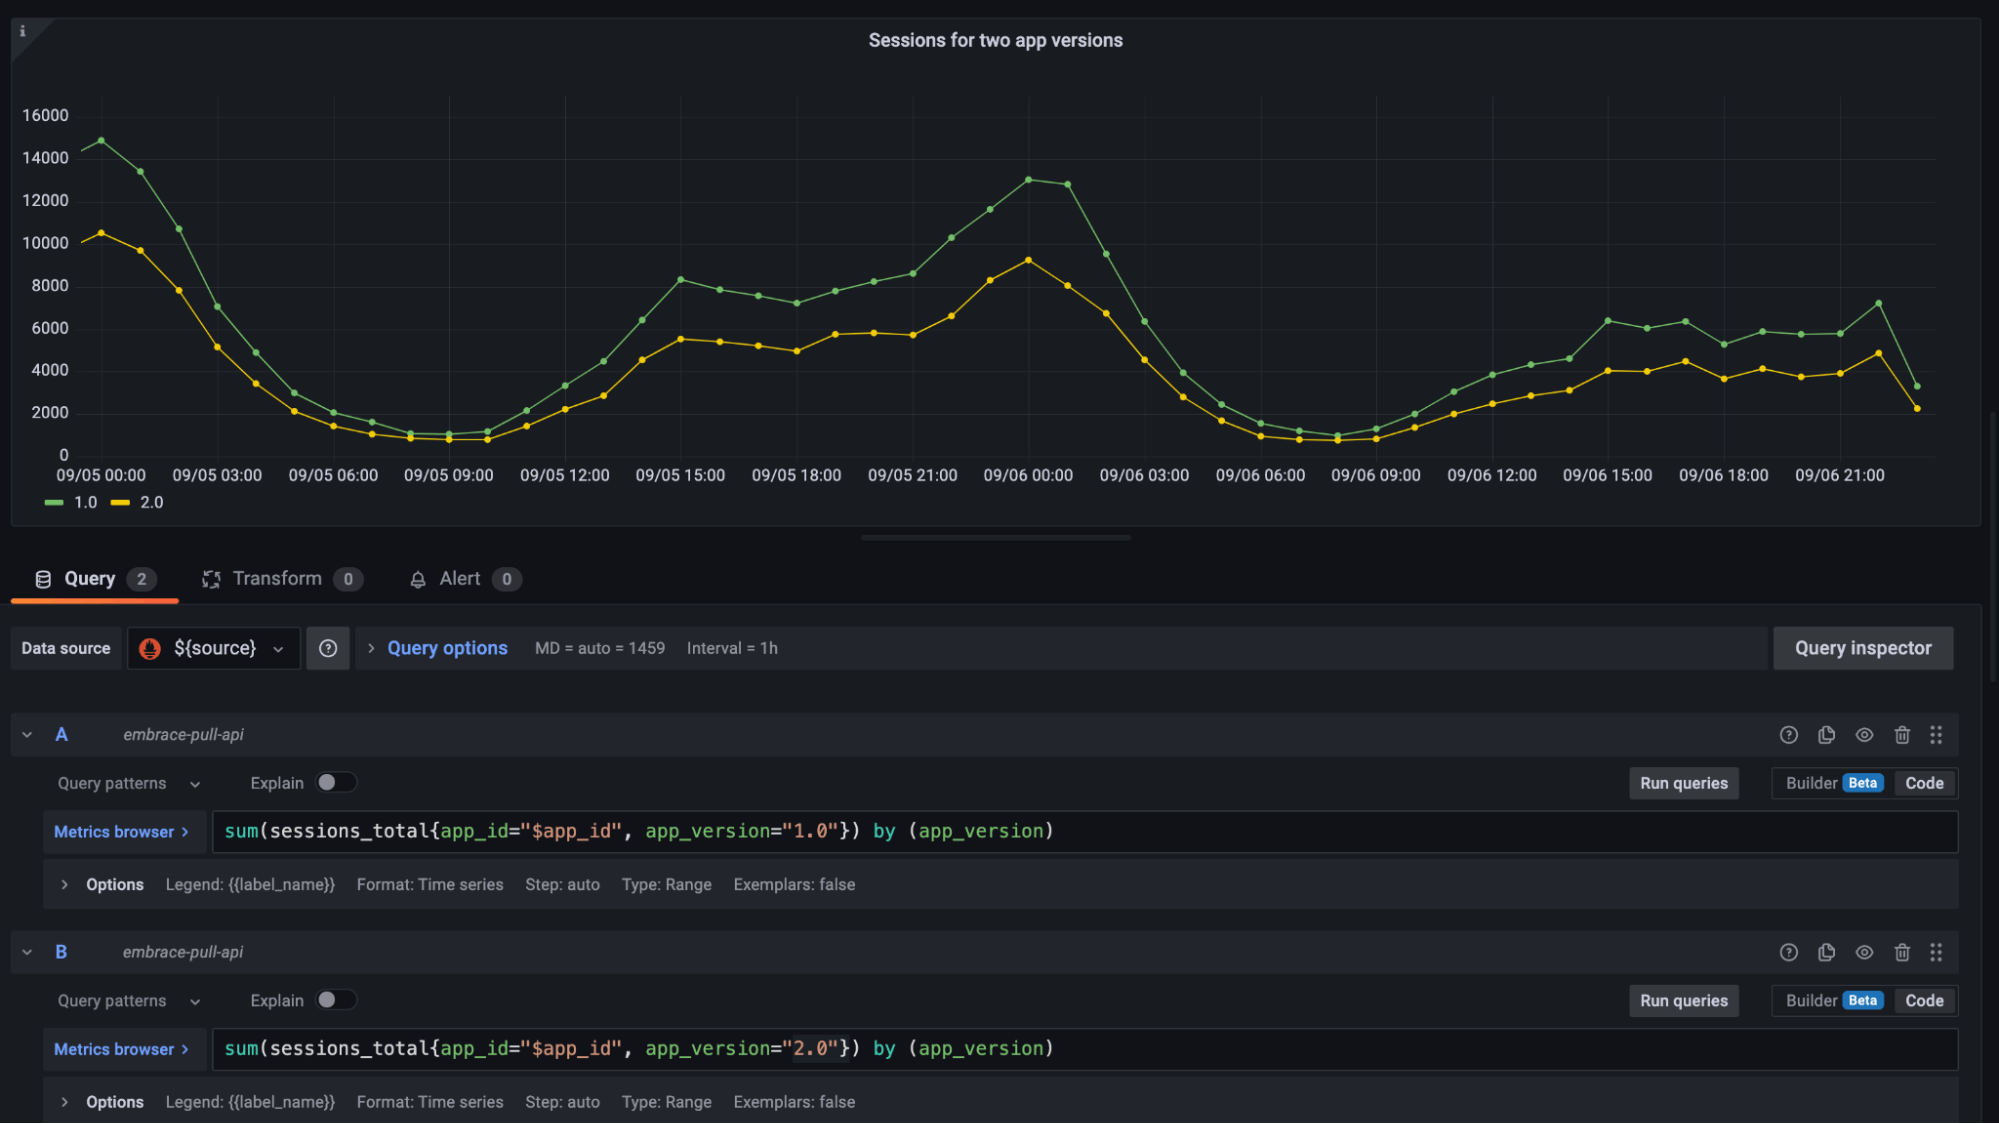
3. Combining multiple frameworks and app platforms alongside analytics data in one place
With Grafana’s robust visualization and query offerings, mobile development teams have the flexibility to take multiple Embrace AppIDs and visualize signals produced by those apps alongside one another. Want to use trend analysis across these various apps? Grafana dashboards give you that ability. Or, combine data coming from any Grafana plugin to build cross-app, analytics driven dashboards for everyone from your mobile team to your executive team.
How to install the Embrace data source plugin for Grafana
The Embrace data source plugin for Grafana is simple to install and allows you to query the Embrace Metrics API with minimal setup. To get started, simply download the Embrace plugin from the Grafana website, install using your Embrace API key, and you will immediately gain access to Embrace metrics flowing in real time. You can refer to the Embrace Grafana documentation to get started.
Learn more about the Embrace plugin
The Embrace plugin for Grafana is now available for all Grafana and Embrace customers. For more information you can request a demo with Embrace or learn more at embrace.io.
Grafana Cloud is the easiest way to get started with metrics, logs, traces, and dashboards. You can sign up for our generous free forever tier and learn more about our plans for every use case.