Watch: How to pair Grafana Faro and Grafana k6 for frontend observability
Grafana Faro and xk6-browser are both new tools within the Grafana Labs open source ecosystem, but the pairing is already showing a lot of potential in terms of frontend monitoring and performance testing.
Faro, which was announced last November, includes a highly configurable SDK that instruments web apps to capture observability signals that can then be correlated with backend and infrastructure data. The xk6-browser, which was released in November 2021, uses browser-level APIs to collect frontend performance metrics for Grafana k6 tests. Collectively, these tools provide a way to get insights into the overall health of your frontend application.
Every Friday, we stream k6 Office Hours, where we talk about k6 or anything that integrates with it. For the first episode of 2023, my fellow k6 Developer Advocate Paul Balogh and I sat down with our colleague Stefan Dunkler, a solutions engineer here at Grafana Labs, to talk about frontend observability with Grafana Faro and xk6-browser.
The episode showcased the integration between Grafana and k6 through:
- xk6-browser, our k6 extension that lets you do browser automation to script a browser user session
- Faro, to collect data about the health of your frontend applications
Watch the video below to learn more about this topic. Or continue reading to get a recap of some of the interesting topics we discussed.
What is browser instrumentation?
Instrumentation refers to the gathering of data needed to observe and monitor your systems. Browser instrumentation involves collecting metrics, logs, and traces from everything that runs in the browser. Since your users interact with different browser types and versions, they also produce specific metrics, error logs, or traces that can only be detected if you instrument your browser.
Regarding observability and monitoring, the backend is only one part of this equation; browser observability and instrumentation are just as important.
How can Grafana Faro help?
Browser instrumentation is critical because some user requests don’t hit the backend, which is where you typically start monitoring. If there is an error in the browser code, then the user leaves your application, and you wouldn’t even notice because all of your typical dashboards will be green.
Before Faro, there was no way to do browser instrumentation with Grafana. Faro solves part of the instrumentation issue by introducing user monitoring from a browser perspective. It helps you understand the following:
- What does a single user do?
- How does this affect the performance of my application?
- How is the overall user experience?
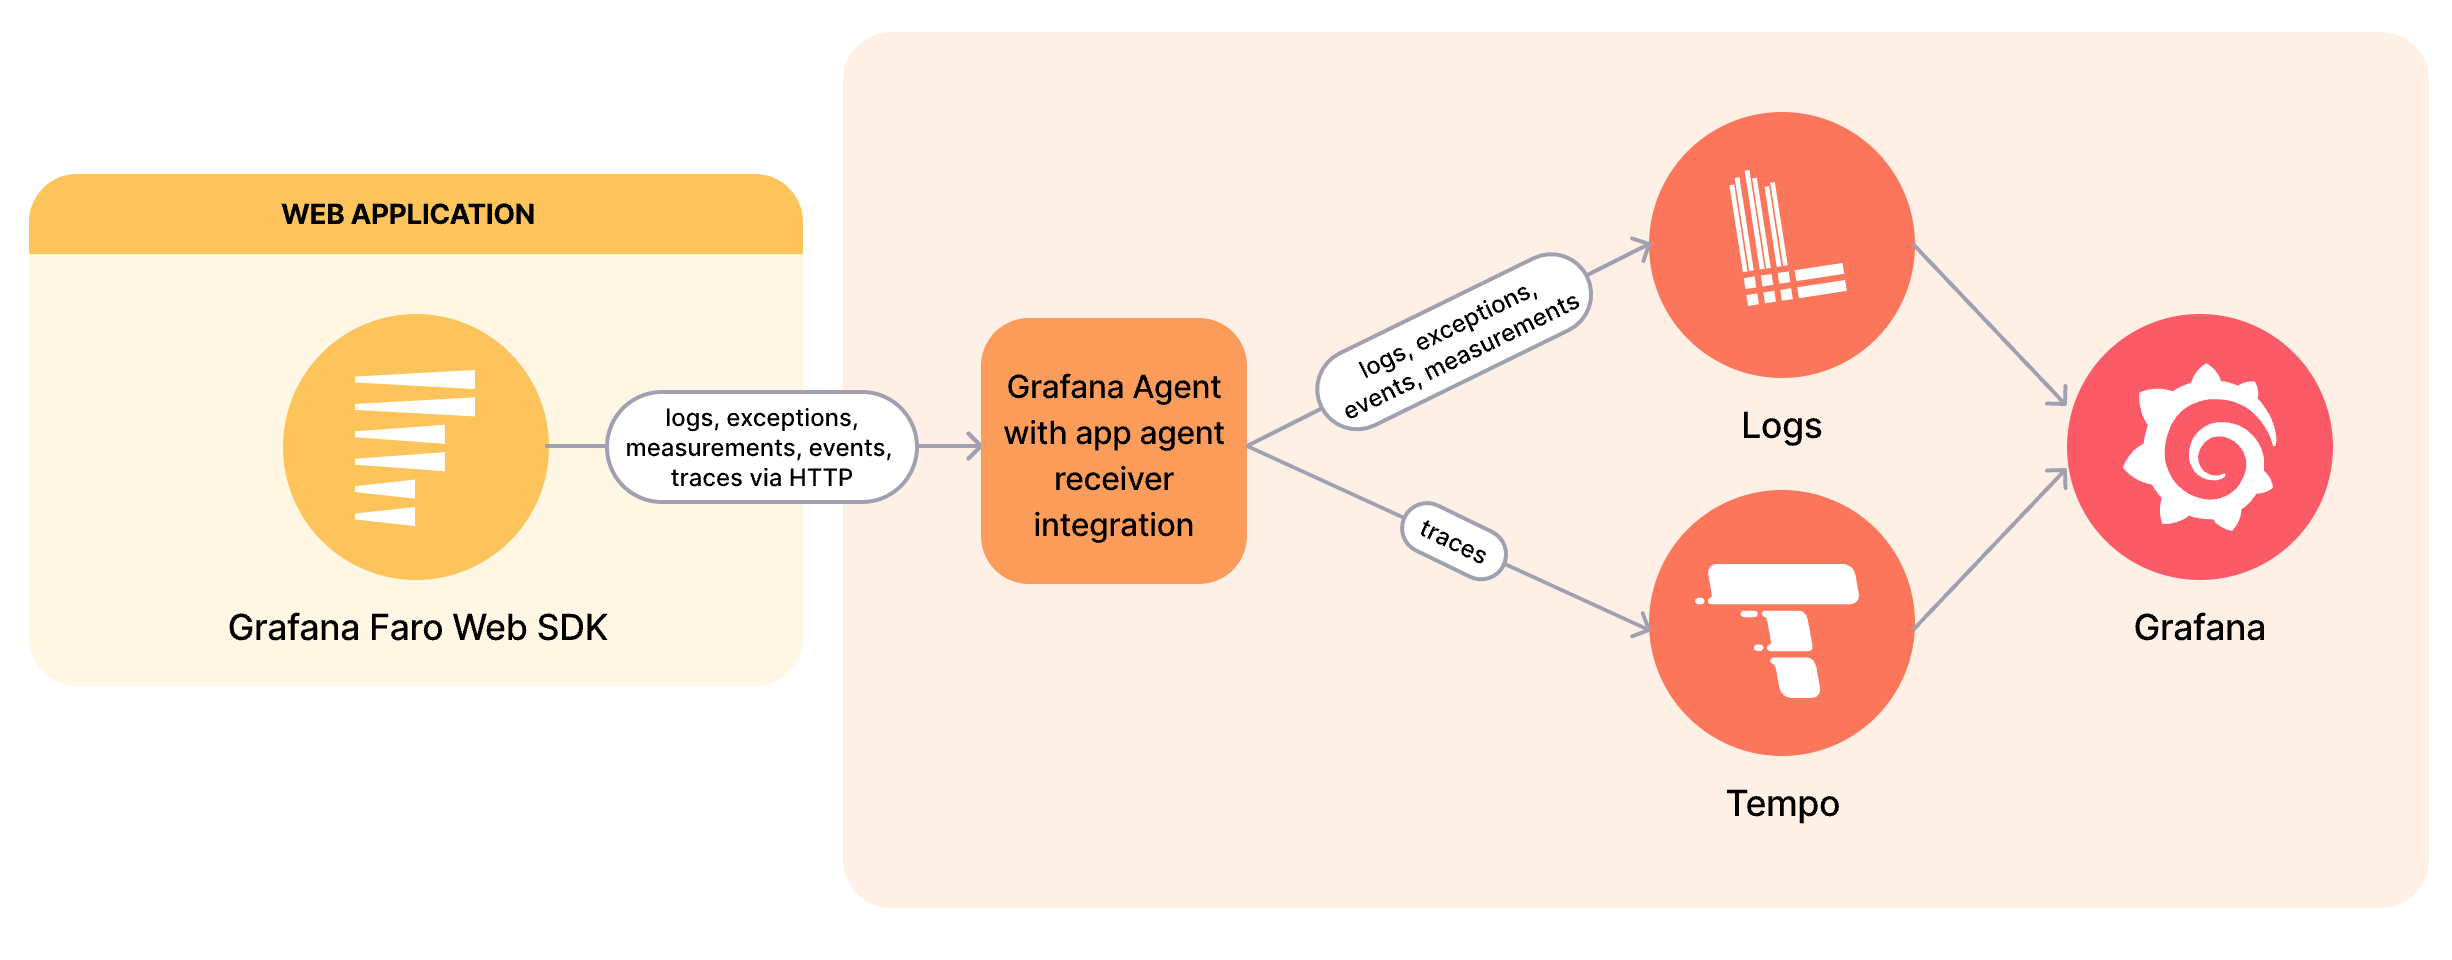
The Grafana Faro SDK collects the necessary browser data, which is submitted to a collector. This collector saves the logs to Grafana Loki and traces to Grafana Tempo, which can then be visualized through a Grafana dashboard.
To learn more about Faro, check out this introductory blog on the open source project.
What type of metrics does Grafana Faro collect?
From a backend perspective, the four golden signals are typically the key metrics to look out for. But those metrics are different from a frontend perspective, because we must also consider the user experience. To address this, the Faro team has integrated web vitals, which are the frontend metrics standards.
In the video, Stefan briefly discussed the different between the various web vitals, such as Largest Contentful Paint (LCP), which measures how long it took to render the largest piece of element in your page, and First Input Delay (FID), which measures how interactive your page is.
First impressions of using xk6-browser
There are, of course, various factors that Stefan considered before trying xk6-browser, such as:
- How mature is the tool?
- Can we talk about this with our customers already?
- What is the value it can add for our customers?
- How easy is it to use?
Though the API is not 100% ready, it’s still very useful. However, a few areas for improvement were called out in the episode:
- Quite a few verbose logs printed on the console that are not necessarily errors from your script.
- You need a few workarounds since the API still needs to be 100% complete.
Without using xk6-browser, Stefan would have needed users to click the web application to find if there were any errors. And if he’d just used k6 core and run tests on a protocol level, he wouldn’t have caught errors specifically on a browser level. This goes to show that there are limitations to just running protocol-level tests.
It’s also important to note that the metrics reported by xk6-browser don’t currently align with Faro metrics, but this is part of our future work, which you can track by following this GitHub issue to implement web vitals.
If you want to know more on how to get started with xk6-browser, check out our previous getting started with xk6-browser blog post.
Demo: How Grafana Faro and xk6-browser work together
The rest of the episode was centered on a demo that showed how Faro works along with xk6-browser. Stefan used the Webshop application as the test application. If you want to play around with the demo project yourself, check out his Github project!

As part of the demo, Stefan emphasized that some Javascript errors won’t get caught if you don’t instrument your browser. He then showed the following data that’s been collected by Faro:
- List of different errors from the browser, such as Javascript exceptions
- List of browsers used and the browser version
- List of URLs with errors
- Web vital metrics and their different measure times

He then demonstrated how to use xk6-browser. From his test script, he used 10 VUs that interact via the protocol level to load test the backend system and one VU to interact with the browser, which both ran concurrently. This showed that you don’t need to spin up hundreds of browsers to catch exceptions in the browser. Clearing performance issues for one user clears about 80% of them without getting into a high load, which is an excellent example of a hybrid approach to performance testing.
Finally, Stefan talked about traces, which were generated by the protocol-level tests using k6. A trace is a holistic view of a request. When a request comes to the backend, you can see how long it took and get a drill-down view of specific paths it called, including the database query. To learn more about distributed tracing with k6 and Grafana Tempo, you can check out our dedicated office hours episode on the topic, read our blog post about correlating performance testing and distributed tracing, or watch our recent ObservabilityCON session about the recent updates to k6 on demand.
Grafana and k6 go better together
This episode demonstrates why Grafana and k6 work so well together. Specifically, it shows how browser monitoring goes hand-in-hand with browser-based performance testing.
I hope you learned something new today and if you decide to try out Faro with xk6-browser, let us know! We love to hear about what you’ve done and how we can improve.
Editor’s note: Marie’s sentiment is even more true now. Grafana k6 load and performance testing is now available natively in Grafana Cloud!
The easiest way to get started with k6 is through Grafana Cloud k6. The free tier includes 500 virtual user hours/month for k6 testing and more. Sign up for free now!