Get to know TraceQL: A powerful new query language for distributed tracing
At Grafana Labs, we love tracing, which is why we’ve been hard at work on Grafana Tempo, an open source, highly scalable distributed tracing backend.
Tempo just had its 2.0 release. In conjunction with that release, we are excited to show off TraceQL — a powerful new query language designed for distributed tracing. In this blog, we’ll provide an overview of why we created TraceQL, how it works, how you can put it to use today, and what we have planned for future iterations.
There’s supposed to be a video here, but for some reason there isn’t. Either we entered the id wrong (oops!), or Vimeo is down. If it’s the latter, we’d expect they’ll be back up and running soon. In the meantime, check out our blog!
Why add TraceQL?
Distributed traces contain a wealth of information, and tools like auto-instrumentation make it easy to start capturing data. But extracting value from traces can be much harder. For example, Tempo metrics-generator can aggregate traces into service graphs and span metrics, and exemplars allow you to navigate from a spike in API latency to a trace that contributed to that spike. But traces can do so much more.
Traces are the flow of events throughout your components. They have a tree structure — with a root, branches, and leaves — arbitrary key/value data at any location, and of course timestamps. So, we wanted to explore: What new questions can we answer with this structure? More than just finding isolated events, can we find sequences of events?
We realized that we needed a new language to express these questions — a language that was designed from the ground up to work well with traces. And, taking inspiration from PromQL and LogQL, we wanted it to have a familiar and flexible syntax.
TraceQL basics
Let’s recap the structure of a trace. As you can see from the image below, we have a trace from a standard three-tiered app with a load-balancer (lb), app, and a database. The tree on the left is the sequence of events starting from the root load balancer and ending with calls to the database. I’ve expanded the details for the main API call in the app and labeled some data points.

- Span name. The unique text for this event:
HTTP GET - root - Service name. The name of the component that created this span:
app. On the left, you can see several spans all fromapp. - Duration. This specific request took 1.72ms.
- Attributes. The metadata attached to this span is a list of key/value pairs that can contain a wealth of information. These values can be anything you want, but there are some industry conventions that improve interoperability and many instrumentation libraries populate data here automatically.
TraceQL is centered around finding spans. Let’s run some search queries against this trace and see what they do.
The simplest query looks like this:
{ }
The conditions inside the braces are applied to each span; if there’s a match, then it’s returned. In this case, there are no conditions so it matches everything. This is useful for troubleshooting but let’s look at a more realistic example. The following query would find the main application API request that is expanded in the screenshot.
{ .service.name = "app" && name = "HTTP GET - root" }
Let’s break this down. The first part is checking the service name. The second part is looking at the span name. The ampersands mean both conditions must be true (logical AND operation).
But we can also filter on the duration and any of the attributes labeled in area:
{ duration > 1ms && .http.method = "GET" && .http.status_code = 200 }
We can use complex boolean logic too. This finds any slow or failing API requests for the app:
{ .service.name = "app" && (duration > 10s || .http.status_code >= 500 ) }
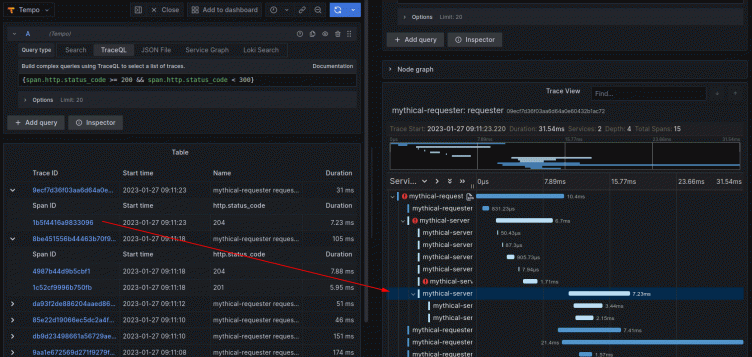
You can use TraceQL with the new user experience in the Tempo data source in Grafana. The TraceQL query editor has auto-complete and returns results in a table. Each matching trace is returned along with an expandable preview of its spans that matched your query.

In the screenshot above, the span IDs (1) are new deep-links that open the trace and scroll to the span. The responsive data columns (2), to the right side of the table, are based on the filters used in the query. Here we searched on the service name, HTTP method, and URL, so they are present with the found values.
Syntax
Let’s look more closely at the syntax. The keen-eyed reader might have noticed that some conditions above begin with a dot (.) and others don’t. This is because TraceQL distinguishes between two types of data: values that are fundamental to the span, which we call intrinsics, and everything else, which is the customizable key/value pairs called attributes.
Here is the list of intrinsics. These are reserved words, used without dots:
namedurationstatus
All other data points reside in the attributes of the span and are fully customizable. These are addressed with a dot (.) , and everything after is the name. Here are some examples:
.http.status_code.service.name.foo.bar
Data types
TraceQL is fully data-type aware and has robust support for text, numeric, and duration operations. Some fields always have the same type (intrinsics like name and duration). Other attributes can have any supported Open Telemetry data type.
- String: efficient case-sensitive matching and regular expressions
- Numeric: your basic comparisons: =, !=, >, >=, etc.
- Duration: User-friendly representations like “10ms” or “15.5s,” and comparisons: =, <, <=, etc.
- Bool: Booleans can be compared against the built-in keywords true and false
- Status: span status can be compared against the built-in keywords ok, error, and unset
Here are some examples:
{ .http.url =~ "/api/v2/.*" }{ .http.status_code >= 500 }{ duration > 10ms }{ .bool = true }{ status = error }
Sometimes within your data the same attribute will have different types, such as userID, which could be a string or an integer. TraceQL does not perform type-casting and instead only checks values of the same type inferred from your query.
{ .userID = 1000 } // Only look at integers
{ .userID = "1000" } // Only look at strings
Scopes
TraceQL has native support for OpenTelemetry’s resource-level and span-level scoped attributes. Using semantic conventions for both resources and spans is a best practice because it supports a common theme throughout your organization, reusable workflows and queries, and better efficiency by reducing duplication. Using scoped syntax, we can target the resource-level attributes, the span-level attributes, or both.
resource.service.name // Check only resource-level attributes
span.service.name // Check only span-level attributes
.service.name // Check both
Pipelines
TraceQL has on-the-fly processing pipelines to perform additional aggregations and filters before returning results. Pipelines are created by using the | (pipe) and can be chained together. This query finds traces that made more than 10 calls to the database, and where the average duration of those database calls was more than 10ms.
{ .service.name = "db" } | count() > 10 | avg(duration) > 10ms
Columns
TraceQL is driven by Tempo’s new Parquet columnar format. It lets Tempo access just the data needed to fulfill the query. For example, if you search for { .http.status_code >= 500 }, Tempo can load just the columns for HTTP status codes, and quickly identify traces with matching values. This also has interesting implications for performance. By tuning your query and narrowing attribute scopes where possible, you can get tight control over which columns will be accessed, which improves search speeds and Tempo’s resource usage. If you are following OpenTelemetry’s semantic conventions, then the two queries below are equivalent, but the first one will run much more efficiently.
{ resource.service.name = "api" && span.http.url = "/method" }
{ .service.name = "api" && .http.url = "/method" }
What’s next
TraceQL is just getting started. We’ve covered how to find spans with a very powerful and expressive language. But what about the questions that I mentioned at the beginning? What new questions can we answer, and how can we find sequences of events? In fact, we already have big plans on how to do this in TraceQL. Here’s a preview of the upcoming advanced capabilities.
Structure queries
Distributed tracing really shines in microservice environments where networks of services communicate with each other. We will be able to write queries that look for sequences of events within the trace:
- Child Operator
{ } > { }: This operator searches for spans in the second filter that are direct children of spans in the first filter. For example this query finds traces where service A directly called service B:
{ .service.name = "A" } > { .service.name = "B" }
- Descendant Operator
{ } >> { }: This operator searches for spans in the second filter that appear anywhere downstream of spans in the first filter. For example this query finds traces where something in the dev cluster caused something to happen in the prod cluster:
{ .cluster = "dev" } >> { .cluster = "prod" }
More pipeline processing
Pipelining is a very powerful feature and we can’t wait to see the creative workflows that it enables. We are adding new stages and aggregations.
- by(.attribute). Split the trace up into groups of spans sharing the same value for the given attribute. Then pass these groups to the next stage in the pipeline.
- coalesce(). The reverse of by(), recombine multiple span groups back together.
- min/max/sum. New aggregation functions in addition to
avgandcount.
When will it be available?
The first phase of TraceQL is available now in Tempo 2.0. The new UX can be previewed in Grafana 9.3+.
Grafana Cloud is the easiest way to get started with metrics, logs, traces, and dashboards. We have a generous free forever tier and plans for every use case. Sign up for free now!


