Monitoring Kubernetes layers: Key metrics to know
Kubernetes monitoring can be difficult and complex. In order to determine the health of your project at every level, from the application to the operating system to the infrastructure, you need to monitor metrics in all the different layers and components — services, containers, pods, deployments, nodes, and clusters.
The power behind Kubernetes metrics lies within the kube-state-metrics service, which listens to the Kubernetes control plane/API server and generates metrics about the resources or objects involved. Just as with other types of monitoring, you can use the information gathered to alert your team on what’s happening inside of the system. Creating alerts on certain metrics can also warn you of impending failures, which helps reduce time to resolution.
In this article, you’ll learn about several component metrics that you should focus on as part of your observability strategy, including:
- Kubernetes cluster metrics
- Control plane metrics
- Kubernetes nodes metrics
- Pod metrics
- Application metrics
Kubernetes monitoring is a vast topic — far broader than this one article could address. Still, the key metrics highlighted below will give you a solid foundation for monitoring all layers of your Kubernetes cluster, so let’s get started!

Why differentiate Kubernetes layers?
Monitoring Kubernetes cluster metrics allows you to gain valuable insights into cluster health status, resource utilization, deployments, and more. However, cluster-level metrics don’t provide enough information to manage the cluster effectively. Why? Consider the following example.
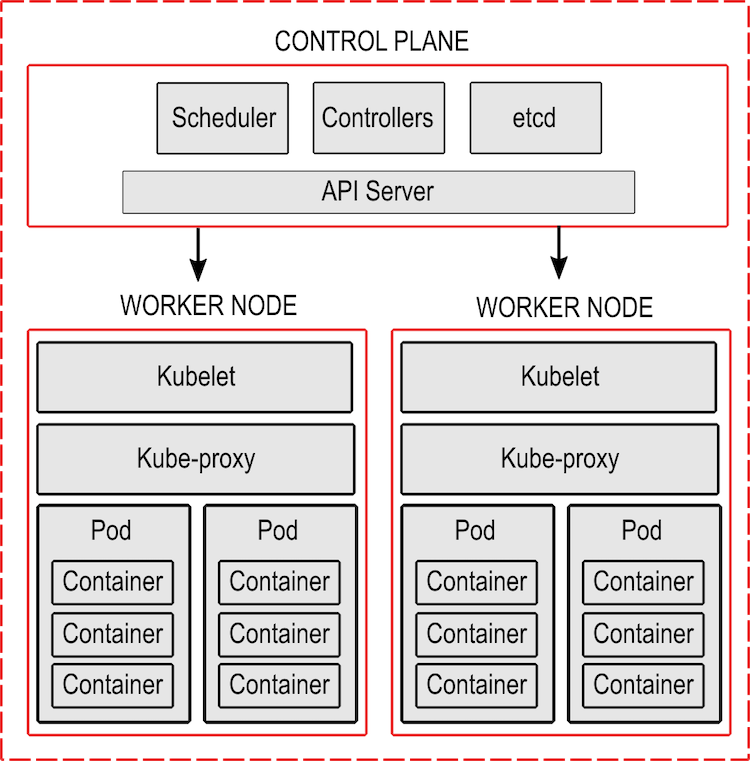
As you can see from the diagram above, we have a Kubernetes cluster consisting of the main node (control plane) and two worker nodes. One of the nodes runs two pods, and one of those pods hosts three containers. Let’s say one of those containers suffers a memory leak and has no limits set, thus consuming all the memory of the node.
In this scenario, monitoring the cluster metrics would show roughly 50% memory utilization. It’s not very useful information, nor is it alarming. But what would happen if you go down a level and monitor the metrics of each node? In that case, one of the nodes would show 100% memory usage — this would reveal a problem, but not its origin. Going down another level to the pod metrics would get you closer to the problem, and going down yet another level to the container metrics would allow you to isolate the culprit of the memory leak.
This simple example shows the value of monitoring the metrics of each Kubernetes layer. Yes, cluster-wide metrics provide a high-level overview of Kubernetes deployment performance, but you’ll need those lower-layer metrics to identify problems and obtain useful insights that will help you administer the cluster and optimize the resources.
That said, you’ll need to know where you can get the metrics for each layer. In Kubernetes, use the Metrics Server to get live information about the resource utilization of Kubernetes objects like pods, nodes, deployments, services, etc. The Metrics Server obtains the metrics from the kubelets and exposes them through the Metrics API so they can be used by the Horizontal Pod Autoscaler, the Vertical Pod Autoscaler, and the kubectl command line utility via the kubectl top command.
If you want to know about the state of Kubernetes objects, kube-state-metrics is a service that listens to the Kubernetes API and generates metrics. Although the Metrics Server and kube-state-metrics seem to provide the same information, there is a difference between displaying resource utilization metrics, such as memory usage, and the state of an object, such as the number of desired replicas.
Another source of metrics is cAdvisor, which exposes usage and performance metrics for containers.
It’s worth clarifying that although the metrics exposed by each of the components referenced here are not the same, they are still closely related since they provide a different angle of each layer. Going back to the earlier memory leak example, you could use cAdvisor to gather metrics on the total memory usage of a specific container. However, to get there, you first need to identify the node and pod that the container belongs to using the information from kube-state-metrics.
While kube-state-metrics exposes a large number of metrics, not all of them are easy to analyze using kubectl. An effective solution for scraping these metrics on each layer is Prometheus, which can be combined with Grafana for analysis and visualization.
5 types of Kubernetes metrics to monitor
Here are some key metrics to monitor at each level of Kubernetes.
1. Kubernetes cluster metrics
Cluster metrics, which are at the highest and most important layer, can provide complete visibility into what’s happening in your environment. They include anything from pods to deployments to memory and disk usage on your cluster. Since these metrics provide a high-level overview of the cluster, it’s ideal to use a visualization platform to monitor the most important resources of the cluster such as memory, disk, and CPU usage.
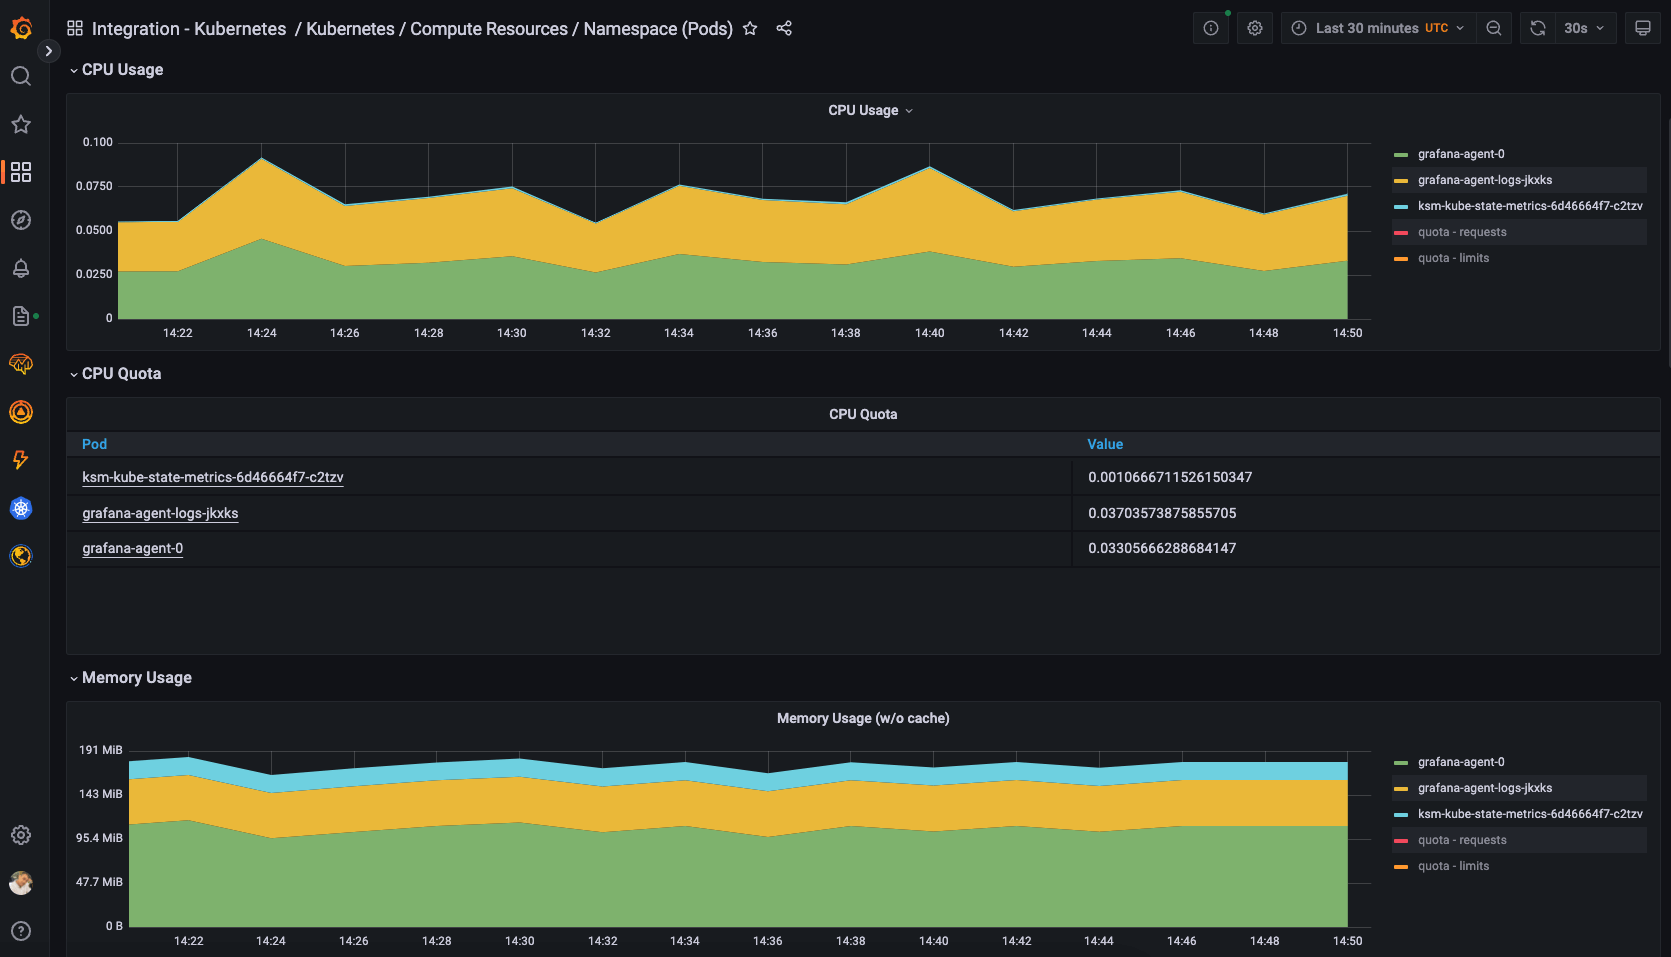
The image above shows some of these metrics in Grafana Cloud. Other important metrics to monitor in this layer are the statuses of nodes and deployments, as they can show problems like an unavailable node or deployment. You can monitor these statuses with the kubectl get nodes and kubectl get deployments commands, respectively.
The output for kubectl get nodes would be something similar to:
NAME                   STATUS   ROLES                  AGE     VERSION
lima-rancher-desktop   Ready    control-plane,master   3h57m   v1.23.6+k3s1
Note that node status can also be obtained directly from kube-state-metrics by searching for kube_node_status_condition. This status can help you quickly understand the state of all nodes in the cluster. And if you use Grafana as part of your Kubernetes management, you can create a central dashboard to monitor the cluster. So, for example, you can create dashboards that include valuable metrics such as:
kube_deployment_status_replicas_unavailable, which indicates the number of pods that are not available in a deploymentkube_deployment_spec_replicas, which allows you to monitor the number of pods that are running in a deployment
All in all, this layer allows you to have a general idea of the performance of the cluster and the status of the nodes.
2. Control plane metrics
The next step would be to go down a level to analyze the control plane metrics. The control plane consists of several layers that you’ll want metrics for, including:
- The API server
- The data store (etcd)
- The scheduler, which schedules pods for nodes
- The controller manager, which manages Kubernetes controllers
You need to monitor the control plane in order to properly operationalize a Kubernetes cluster. And all of the elements listed above are needed to have a functional control plane, so each one should be monitored with specific care.
Here are some key metrics exposed by this layer that would be good to include in your dashboards:
apiserver_request_latencies_countshows the number of requests made to the API server for a specific resource (pods, deployments, services, etc). It’s useful to monitor whether too many API server calls are being received from a specific resource.apiserver_request_latencies_sumshows the total latency of a specific resource or verb. When combined withapiserver_request_latencies_count, it can give you insight into whether the cluster is at full capacity and starting to lag.scheduler_e2e_scheduling_duration_secondsshows the latency when scheduling a load on a node. It’s useful to detect whether one or more nodes no longer have enough resources to run more pods. It’s also useful for latency optimization improvements.etcd_server_has_leaderis a valuable metric to detect if the cluster has lost its lead node, which is usually due to a network failure.
3. Kubernetes nodes metrics
We’ve already discussed a metric related to the status of nodes when explaining Kubernetes cluster metrics. Some more valuable metrics include:
kube_node_status_capacityindicates the capacity for different resources of a node, allowing you to pinpoint available node resources.kubelet_running_container_countshows the number of containers that are currently running on a node.kubelet_runtime_operations_latency_microsecondsindicates the latency of each operation by type in microseconds. Like other latency metrics, it is useful for optimization and bottleneck detection.
As part of your observability strategy, it’s vital to include node-specific metrics that allow you to keep an eye on system load, memory usage, disk I/O, available disk space, network traffic, and more — in short, conventional metrics you would monitor in a conventional virtual machine. To do this, you can use predefined dashboards like the Kubernetes Node Dashboard available on Grafana.
4. Pod metrics
Pod metrics monitor how the pod is performing from a resource perspective. If an application running in a pod gets more requests than usual, it may need to scale horizontally. If a pod keeps getting increased utilization needs, it’s time to scale the quota/rate limits for CPU and memory.
There are specific metric paths for DaemonSets, deployments, and pods.
5. Application metrics
Application metrics measure how the application is performing. A pod could be running and operating as expected, but that doesn’t necessarily mean the underlying binary/app running inside of the pod is up and running as expected. Because of that, you need to think about RED metrics: request rate, error rate, and duration.
Thinking about what metrics the application’s endpoint exposes makes sense as well. For example, if it’s a web app, you might need to determine if the frontend is still reachable.
If you’re interested in monitoring your Kubernetes clusters but don’t want to do it all on your own, we offer Kubernetes Monitoring in Grafana Cloud — the full solution for all levels of Kubernetes usage that gives you out-of-the-box access to your Kubernetes infrastructure’s metrics, logs, and Kubernetes events as well as prebuilt dashboards and alerts. Kubernetes Monitoring is available to all Grafana Cloud users, including those in our generous free tier. If you don’t already have a Grafana Cloud account, you can sign up for a free account today!

