4 billion logs, 120 TB of data: How Just Eat Takeaway.com uses Grafana Cloud to scale
In 2017, Just Eat Takeaway.com (JET) was transitioning from a scrappy startup to a surging scaleup. With a global customer base and workforce, the food delivery marketplace’s front line teams needed to scale the real-time monitoring of the platform.
Their initial efforts looked like “NASA’s mission control with Grafana dashboards,” said Senior Technology Manager Alex Murray. But as growth continued, they started seeing issues with missing or incomplete data, which lead to false positives and incorrect alerts. Their moonshot challenge was clear: They needed to re-architect their operations.
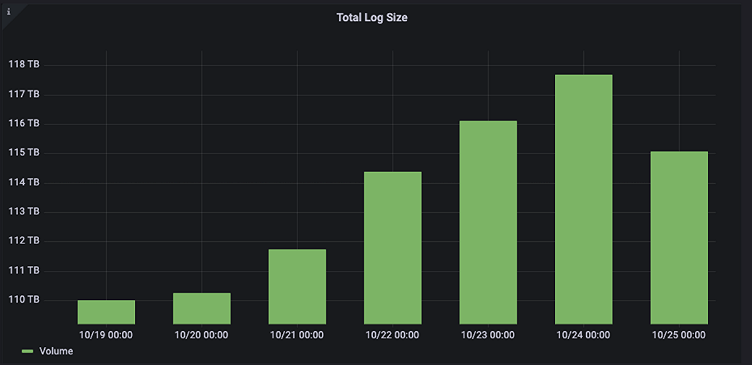
Today, their efforts have helped maintain an observability ecosystem with staggering numbers. JET has 94 million customers, as well as a team of 900 engineers and developers overseeing more than 700 microservices. That translates to 4 billion logs and 2 billion data points a day, 8 million active metric series, and nearly 120 terabytes of usable data.
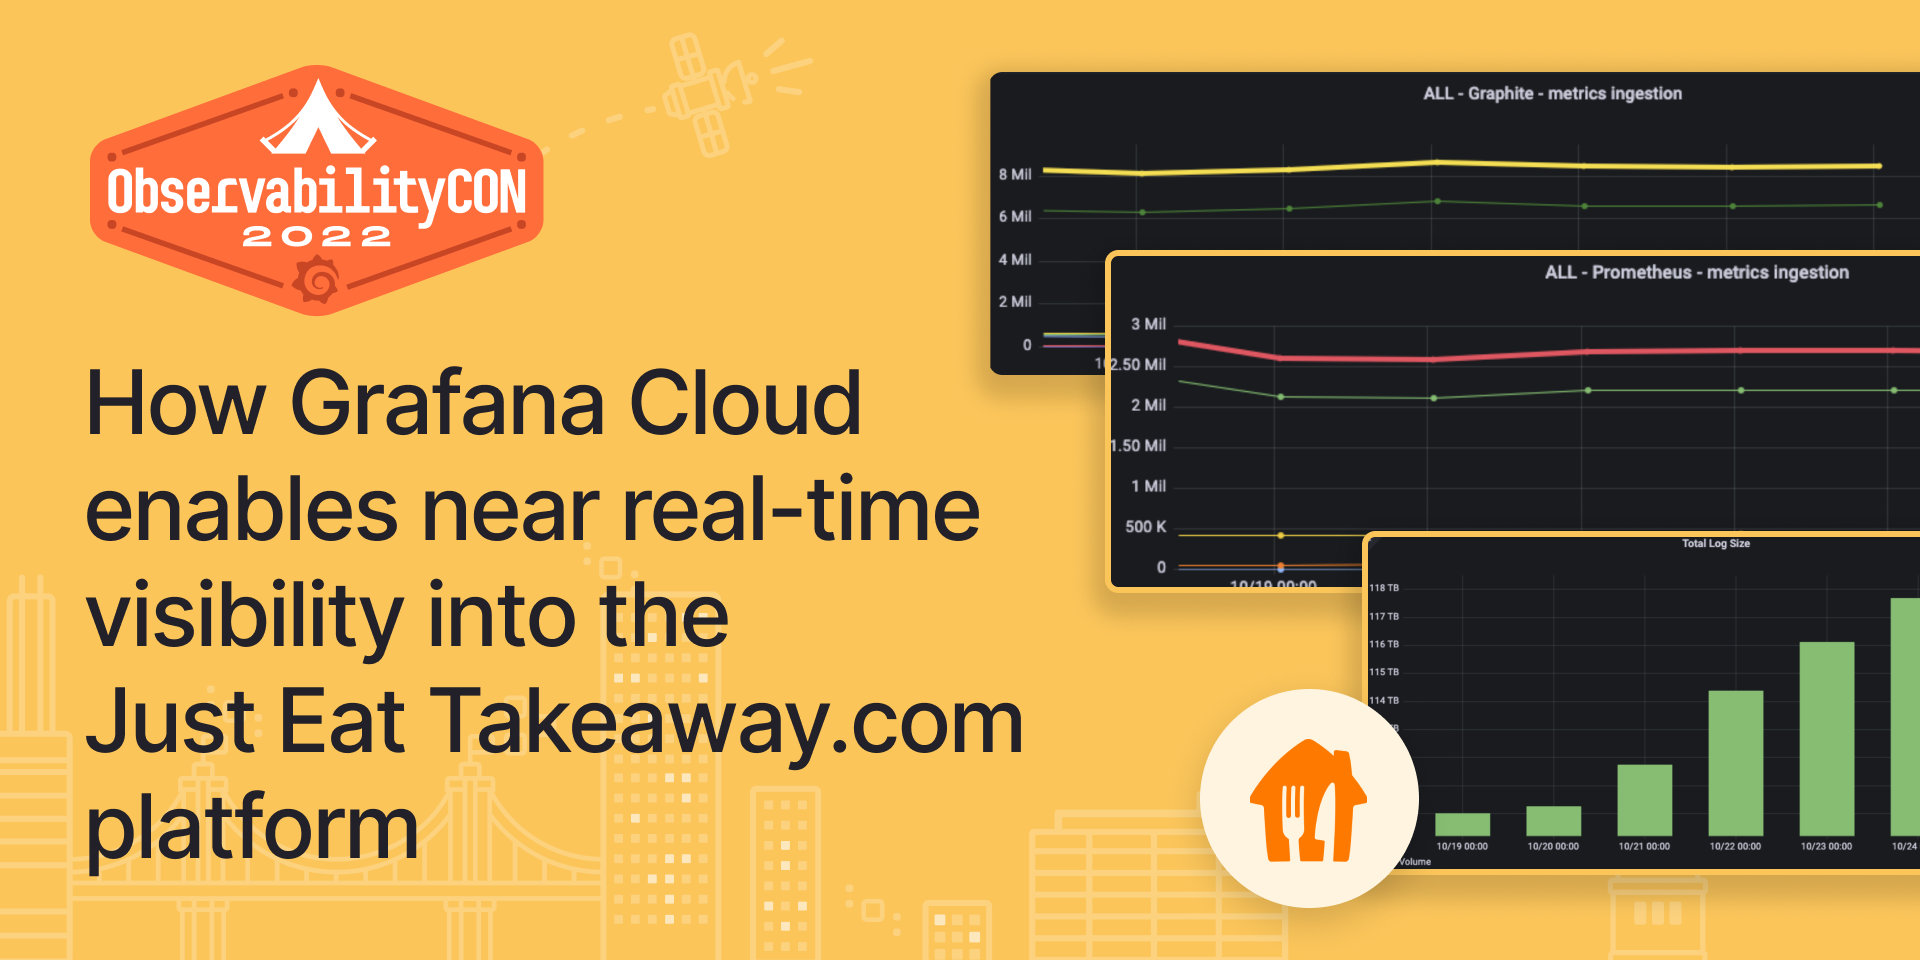
In their recent ObservabilityCon 2022 session titled “How Grafana Cloud enables near real-time visibility into the Just Eat Takeaway.com platform,” Murray and Principal Platform Engineer Andrew Marwood walked through their observability journey, including how they leveraged Grafana Cloud and their focus on OpenTelemetry moving forward.
Shifting to a hybrid model with Graphite and Grafana Cloud
JET initially maintained several self-hosted Graphite stacks, sharding the data across multiple instances to protect against failures. But the approach became costly and difficult to manage, so they adopted a hybrid model pairing short-term data storage on local Graphite infrastructure (primarily used for alerting) with Grafana Cloud for dashboarding and long-term queries.
“This gave us time and capacity to improve the offering for our customers in engineering, and we had room to breathe,” said Marwood.
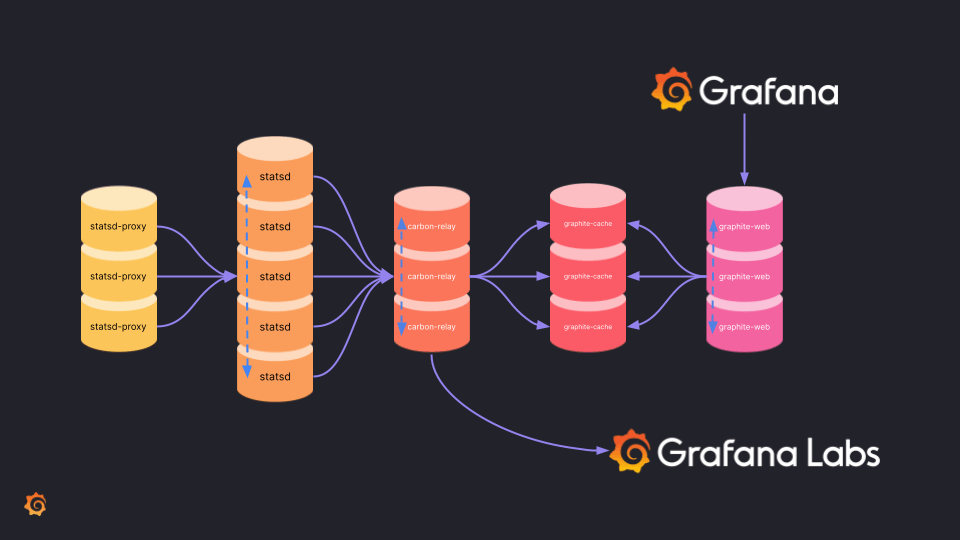
The team load tested the new model to ensure it could handle the traffic surge at peak trading times. “This solidified Grafana as our single pane of glass for working with telemetry data,” Marwood added. “Engineering teams started building tools around our observability platform, which showed confidence in what we had built. A great example of this is the internal project to create dashboards as code. This increased consistency across dashboards and reduced the amount of work needed to build and maintain dashboards on applications teams own.”
How to scale with Grafana Cloud: Lessons learned
In their journey to bring reliability and resiliency into their monitoring and logging, Murray and Marwood gained insights they shared during their talk:
- Scaling observability systems means also scaling processes. Given the size of the engineering team, they knew they couldn’t train each employee individually. So they spent their time on documentation, internal presentations, and demos to show best practices for using the observability tools. All of this work led to the adoption of structured logging and an increase in contextual data being sent with log events.
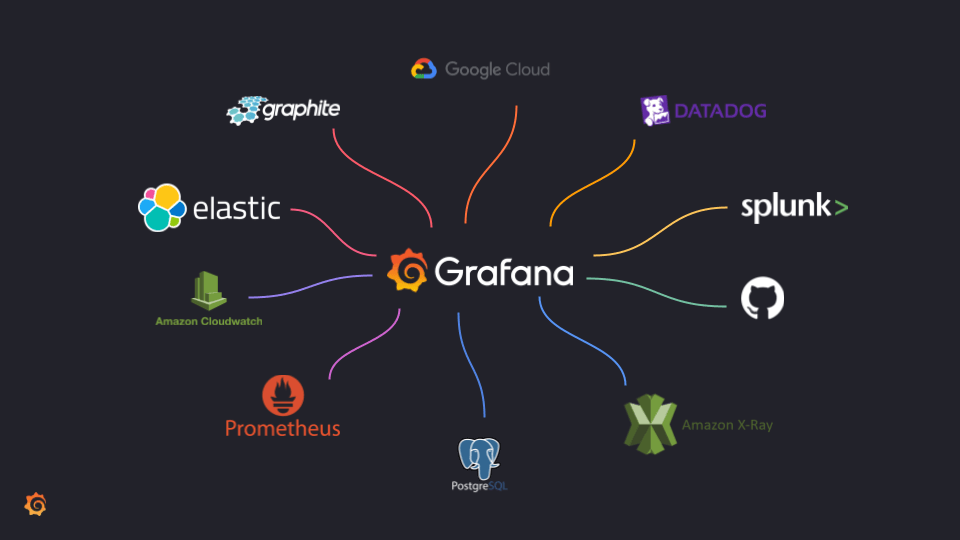
- Go hybrid. Their hybrid system reduces the complexity of managed infrastructure (from Prometheus to Graphite) and easily integrates new telemetry data sources. “[Grafana] provides a common interface to access telemetry data, reducing context switching between tools,” said Marwood. “We have the flexibility to make the choice between using a SaaS product or running it ourselves.”
- Allow for growth and evolution. The team’s approach to observability pushes on innovation. Believing that perfect is the enemy of good, they continually make improvements based on feedback and keep an eye on what’s new in the space. According to Murray, the team doesn’t focus on standardizing on a tool set, but on telemetry data.
What’s next?
The next phase of their evolution includes focusing on OpenTelemetry. “With it we have a common observability language not mandated by a specific vendor or tool,” said Murray, who added that their initial proof of concept focused on OpenTelemetry tracing with Grafana Tempo and has led to performance improvement. In the long term, “this will provide consistency and free up our engineering teams,” said Murray. “It’s a really encouraging and exciting place.”
Get more details on Just Eat Takeaway.com’s methodology for scaling observability with Grafana Cloud by watching their full session. All our sessions from ObservabilityCON 2022 are now available on demand.

