
Grafana Cloud 2022: Year in review
With every new update and feature we introduced to our open source LGTM stack this year, we have also enhanced Grafana Cloud, our hosted offering that is powered by Grafana Loki for logs, Grafana for visualization, Grafana Tempo for traces, and Grafana Mimir for metrics.
With Grafana Cloud, “we have curated the open source experience into an easy-to-use, opinionated, and integrated platform,” Grafana Labs VP of Technology Tom Wilkie said in the ObservabilityCON 2022 keynote. “It’s really aimed at people who don’t have the time and expertise to self-assemble the DIY approach. But it’s still powered by the same open source projects you know and love.”

This year we’ve also added solutions, integrations, and upgrades to the Grafana Cloud experience and expanded the hosted service so that our cloud observability platform is available around the world.
Here are some of the ways we took Grafana Cloud to the next level in 2022.
Kubernetes Monitoring in Grafana Cloud
This year we took our initial Kubernetes integration and enhanced it into a richer, more curated Kubernetes Monitoring solution that is available across all tiers of Grafana Cloud, including our free forever plan. (Sign up for a free Grafana Cloud account today!)

Within the Kubernetes Monitoring solution, we built a React app that allows you to navigate through your workloads, namespaces, and nodes to understand the behavior of your application inside Kubernetes. The out-of-the-box solution also includes a highly curated set of metrics, instant Kubernetes logging, and prebuilt dashboards so you can easily get started visualizing and alerting on your Kubernetes clusters.
Launched in July, Kubernetes Monitoring currently has more than 1,000 monthly users, including our own teams at Grafana Labs.
To learn more, visit our Kubernetes Monitoring solutions page or read our Introduction to Kubernetes Monitoring. You can also reference our Kubernetes Monitoring documentation or watch our “Kubernetes monitoring out of the box with Grafana Cloud” webinar on demand.
New Incident Management & Response (IRM) tools
Grafana naturally sits at the heart of incident response management (IRM), and with the recent releases of Grafana OnCall on Grafana Cloud, Grafana Incident, and the ongoing enhancements to Grafana Alerting, we’ve created a unified IRM stack in Grafana Cloud that seamlessly integrates into your Grafana workflows. With the following suite of IRM tools, you can detect changes in your system, respond to incidents as they occur, and solve problems all in one place. Plus, it’s all built right on top of your observability data.
To learn more about the entire IRM stack in Grafana Cloud, you can watch our ObservabilityCON talk “Incident response made easier” on demand.

Grafana Alerting
Grafana Alerting became the default alerting system with the release of Grafana 9.0. With Grafana Alerting, you can define alerts from multiple different data sources and also use Grafana Machine Learning to understand the data via Outlier Detection or adaptive thresholding in order to enhance your alerts and send them out to your teams via your preferred tools (PagerDuty, Opsgenie, etc). We also introduced Terraform provider support for Grafana Alerting, which makes it easy to create, manage, and maintain your entire Grafana Alerting stack as code.
To learn more, check out our Grafana Alerting documentation and our videos on how to create alerts in Grafana Alerting.
Grafana OnCall
Grafana OnCall, which became generally available in Grafana Cloud earlier this year, is an easy-to-use on-call management tool built for engineers, by engineers that will help reduce toil through simpler workflows. Grafana OnCall helps you make sure you escalate your alerts to the right people at the right time. Following our “big tent” philosophy, Grafana OnCall accepts alerts from a host of different platforms (Zabbix, Prometheus, DataDog, etc.) Along with integrating seamlessly with a wide variety of ChatOps tools (Slack, Microsoft Teams, Telegram), we’ve also rolled out the most requested feature Grafana OnCall users have been asking for: You can now manage your on-call rotations from the Grafana UI, your calendar, or Terraform.
To find out more, read our Grafana OnCall documentation and watch our webinar “Getting started with Grafana OnCall for on-call management” on demand.
Grafana Incident
Generally available in Grafana Cloud starting in September, Grafana Incident is the incident management tool that picks up useful behaviors that will set your teams up for success when things go wrong. Once the team receives an escalation, Grafana Incident allows them to investigate issues as they are happening, maintaining a high level of context so you can understand where things are going wrong while also making it easy to communicate updates to stakeholders as needed. Post-incident, the tool will help you manage the fallout and gain important insights on the path to avoiding the same issues in the future.
Curious to hear more? You can dive into our Grafana Incident documentation and our “Getting started with Grafana Incident for incident management” webinar on demand.
More Grafana Cloud integrations
In addition to giving users a quick start to observability, we have been building our catalog of Grafana Cloud integrations to help you easily deploy observability best practices throughout your organization at large.
We are heading into the new year with more than 50 infrastructure integrations on the Grafana Cloud platform, with key solutions such as GitLab and Raspberry Pi.

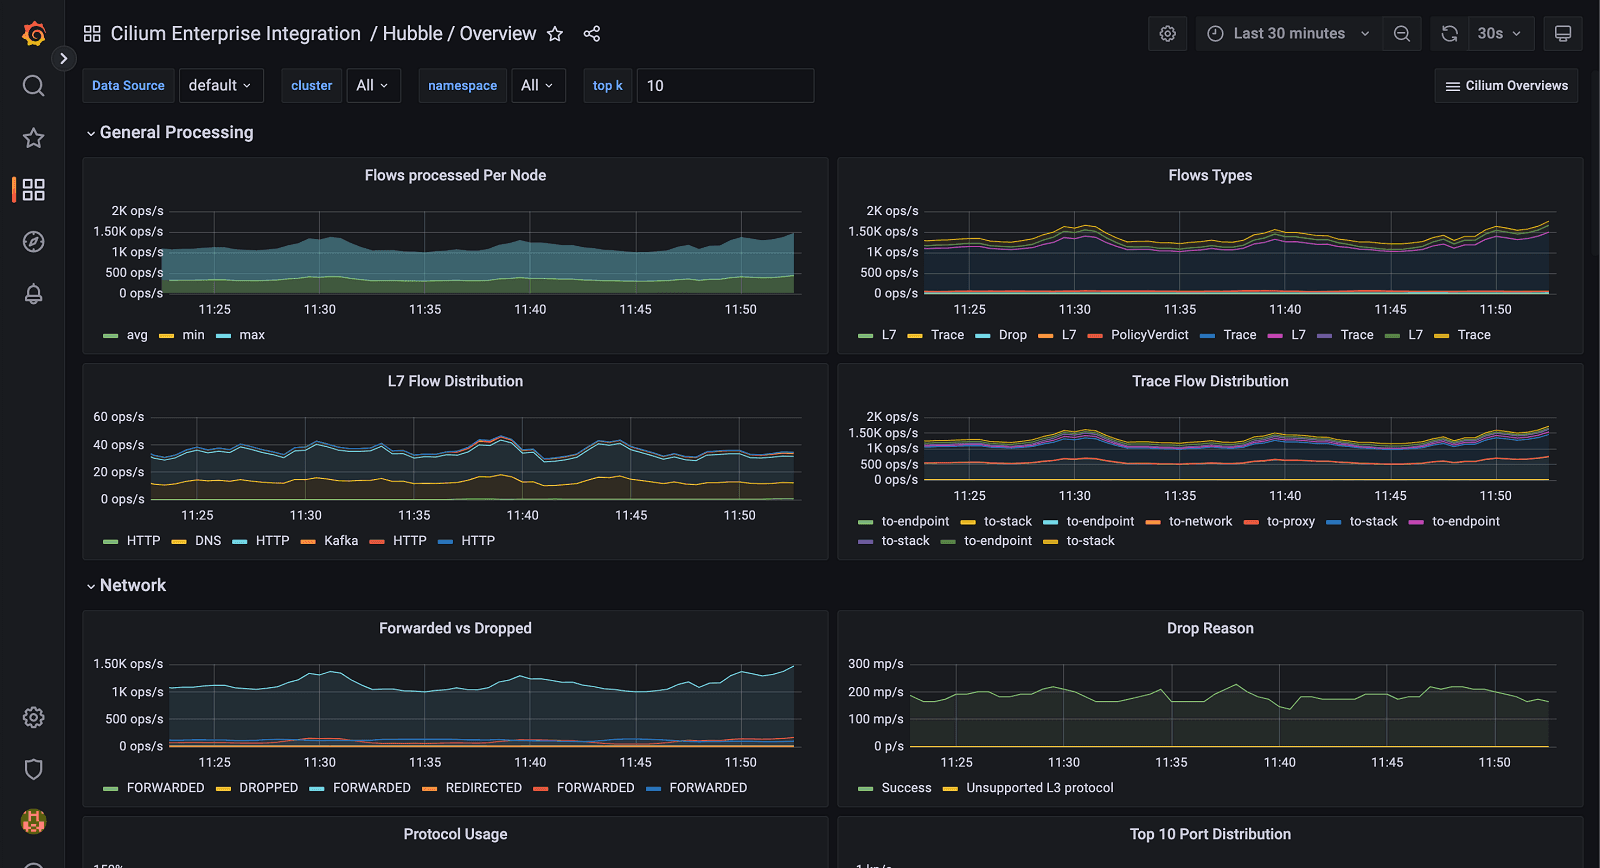
We also formed strategic partnerships to build solutions with Confluent Cloud and HashiCorp Vault. And one of the highlights of 2022 for Grafana Labs was joining forces with Isovalent, the creators of Cilium, which has resulted in the Cilium Enterprise integration.
Logs were a major focus for Grafana Cloud integrations, as well. Our teams added default logs support to some of our most popular integrations such as Linux, Windows, My SQL, and Docker. In addition, we rolled out support for Heroku logs and CloudWatch logs.
To learn more about infrastructure monitoring in Grafana Cloud, watch our ObservabilityCON session “Deep dive into Grafana Cloud integrations for easy-to-use infrastructure monitoring” on demand.
If you’re not already using Grafana Cloud — the easiest way to get started with observability — sign up now for a free 14-day trial of Grafana Cloud Pro, with unlimited metrics, logs, traces, and users, long-term retention, and access to one Enterprise plugin.

