Grafana Labs in 2022: Top 10 moments of the year
There are more than a million reasons (and Grafana instances!) that have made 2022 a standout year at Grafana Labs. But here are the top 10 releases, products, company milestones, and major announcements that were off the charts.
1. Celebrated more than 1 million active Grafana instances
When Torkel Ödegaard launched the Grafana open source project with his first commit in December 2013, “my goal was to make time series data accessible for a wider audience,” he said.
Almost nine years and many commits later, Grafana celebrated a big benchmark this year: There are now more than 1 million active Grafana instances in the wild!
There’s supposed to be a video here, but for some reason there isn’t. Either we entered the id wrong (oops!), or Vimeo is down. If it’s the latter, we’d expect they’ll be back up and running soon. In the meantime, check out our blog!
We are grateful for our entire Grafana community, so to all of our users, contributors, and customers, we simply want to say: Thanks a million!
2. Launched four new open source projects
“Open source has always been and continues to be at the heart of everything we do,” Grafana Labs CEO and co-founder Raj Dutt said at GrafanaCONline 2022. This year we welcomed four new OSS projects into the Grafana Labs family:
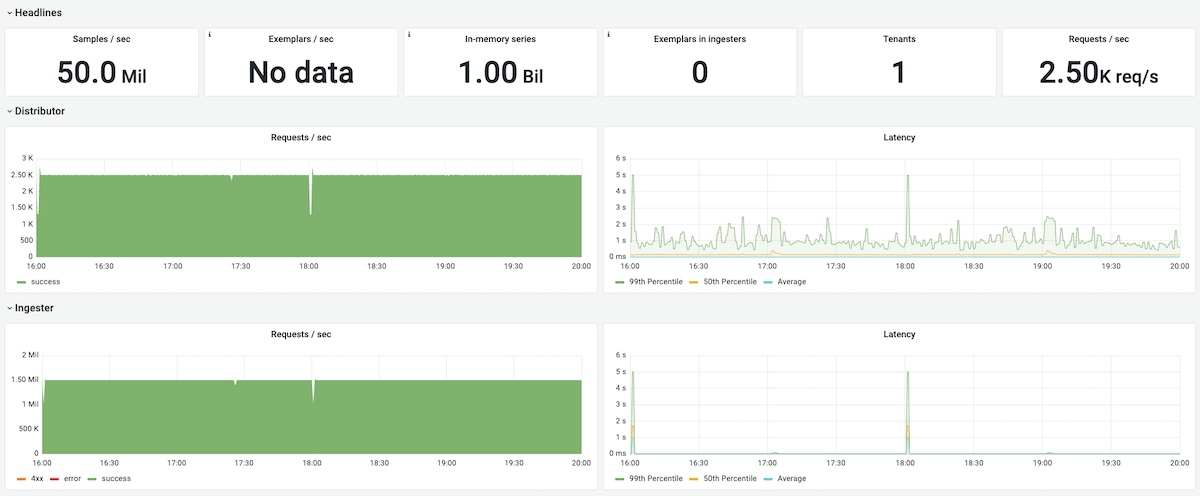
Grafana Mimir was rolled out in March as the most scalable, most performant open source time series database in the world. Mimir allows you to scale to 1 billion metrics and beyond, with simplified deployment, high availability, multi-tenancy, durable storage, and blazing fast query performance. To learn more, read our Grafana Mimir announcement blog post.
![Grafana dashboard showing how Grafana Mimir scaled to 1 billion active series.]()
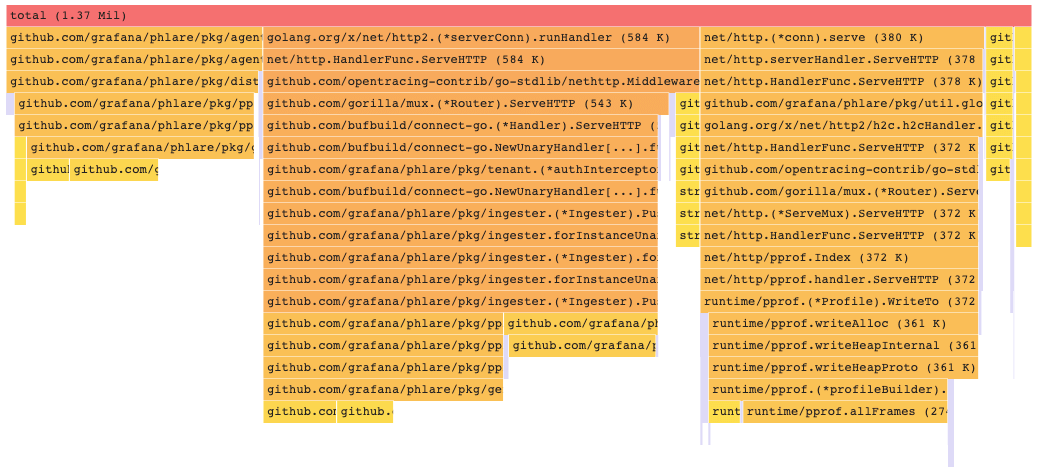
Grafana Phlare, which was made public on stage at ObservabilityCON, is the new horizontally scalable, highly available, open source backend for continuous profiling data. We also introduced a new flame graph panel for visualizing profiling data in Grafana. To learn more, read our Grafana Phlare announcement blog post.
![Flame graph visualization in Grafana.]()
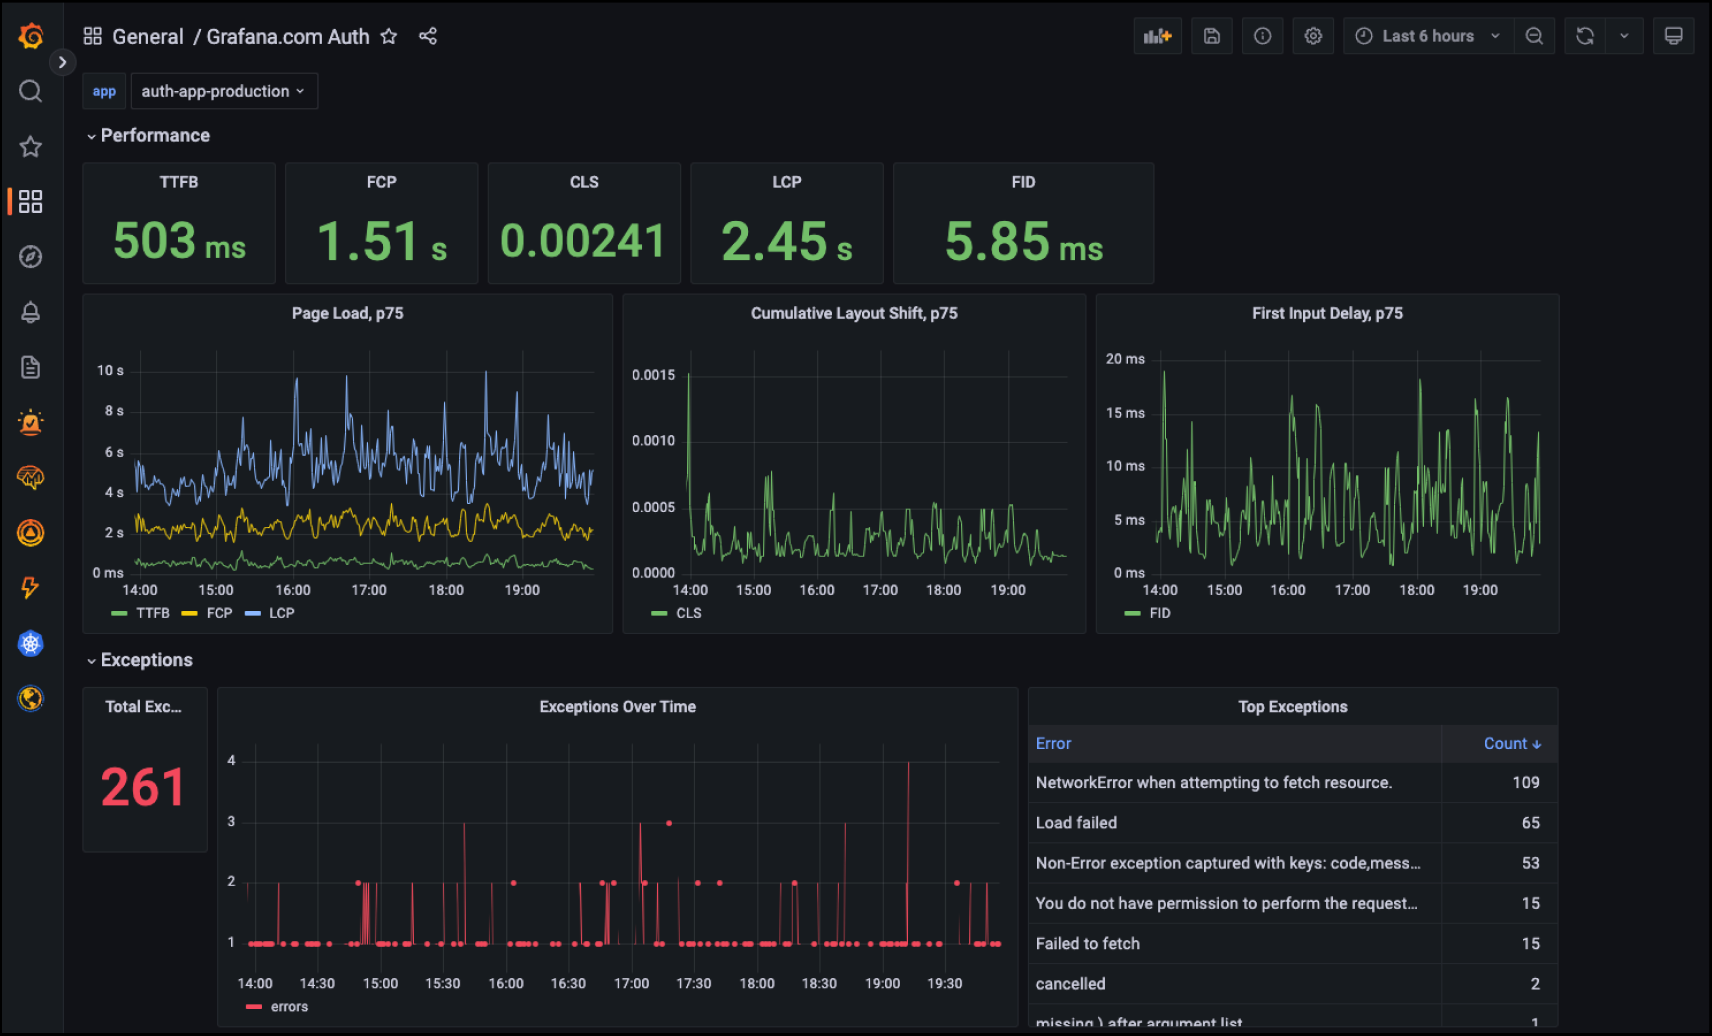
Grafana Faro is our new open source project for frontend application observability. The project launched with a highly configurable web SDK that instruments web applications to capture observability signals. This frontend telemetry can then be correlated with backend and infrastructure data for seamless, full-stack observability. To learn more about, read our Grafana Faro announcement blog post.
![Grafana dashboard showing Grafana Faro data]()
Grafana OnCall is an open source on-call management system featuring simpler workflows and interfaces tailored for developers. For users who can’t deploy a cloud-based solution due to security requirements, legal issues around sensitive data, limited connectivity, and other reasons, you can now install, administer, and maintain your own OnCall instance. Read our Grafana OnCall announcement blog post.
![Image announcing Grafana OnCall OSS with logo]()

3. Released Grafana 9.0
Grafana 9.0’s primary focus has been to improve the user experience, making observability and data visualization easier and more accessible for everyone.
Along with significant improvements to the navigation, search engine, and UI (hello, command palette!), we’ve also made it simple to query and visualize your data by rolling out the Prometheus query builder and Grafana Loki query builder as well as introducing visualization suggestions.
Naturally there are also new visualizations to make your dashboards even more engaging and dynamic, including an updated heatmap, an amped up geomap, a new candlestick panel, and more.
Plus we showcased another great use case for Grafana: Presenting a GrafanaCONline demo! Watch our “Deep dive into Grafana 9” session on demand to see demos of the Grafana 9.0 features.
You can also check out our Grafana blog posts and Grafana documentation to learn more about the minor releases and new features we released throughout the year.
4. Raised $240 million in Series D funding
In April, Grafana Labs closed a $240 million Series D round of investment, which is a major milestone that goes well beyond the dollar amount.
The Series D round was led by GIC, Singapore’s sovereign wealth fund, who was an existing investor along with Sequoia Capital, Coatue, Lightspeed Venture Partners, and Lead Edge Capital – who all also participated in this round, just seven months after our Series C.
This round also marked the addition of J.P. Morgan as an investor. Engineers across JPMorgan Chase have long been active in the Grafana open source community, and in 2018, the company became a Grafana Labs customer. Since then, we have gone above and beyond a typical vendor relationship and enjoyed a true collaboration, which led to our induction into the JPMorgan Chase Hall of Innovation in 2020.
With this funding, we plan to continue delivering on our product roadmap, releasing impactful open source software, bringing new capabilities to market, and above all, listening to the community and our customers to drive innovation.
For more details, check out our Series D investment blog and press release.
5. Answered the critical question: Can Grafana run Doom?
It started as a simple hackathon project — and grew into a viral blog post that became one of our most popular stories of 2022.
Using time series panels and the Grafana Live streaming feature, three Grafanistas-turned-demon-hunters transformed Grafana into a video game interface for Doom, the popular first-person shooter game. In half resolution mode (100x160) alone, the team’s project produced 256 active time series (one per color) and 16,000 data points rendered at ~30 frames per second.
You, too, can enjoy “Doomfana” in half resolution or full resolution. You can also check out the code in the Doomfana Github repo.
There’s supposed to be a video here, but for some reason there isn’t. Either we entered the id wrong (oops!), or Vimeo is down. If it’s the latter, we’d expect they’ll be back up and running soon. In the meantime, check out our blog!
6. Introduced ‘Grafana’s Big Tent’ podcast
This spring, we invited everyone into “Grafana’s Big Tent” — our new podcast about people, community, tech, and tools around observability.
Hosted by VP of Culture Matt Toback, Engineering Director Mat Ryer, and VP Technology Tom Wilkie, the first season of “Grafana’s Big Tent” podcast covered a wide range of topics, including logging, continuous profiling, observability strategies that work, and even the 5 mother sauces of cooking. (That will make sense if you listen to “What even is observability?”) They also sat down with observability experts from the Lego Group, Parca, GitLab, and more to engage in honest, thoughtful, and fun conversations around observability.
Check out all the episodes of “Grafana’s Big Tent” on Apple Podcasts and Spotify.
7. Hosted in-person community events again
Starting this past summer, we took our Grafana LGTM stack on the road. Our Grafana Labs experts met with hundreds of community members, users, and customers vis-a-vis at GrafanaLive events in locations around the world, including Chicago, London, Paris, the San Francisco Bay Area, São Paulo, Sydney, and Melbourne.
There’s supposed to be a video here, but for some reason there isn’t. Either we entered the id wrong (oops!), or Vimeo is down. If it’s the latter, we’d expect they’ll be back up and running soon. In the meantime, check out our blog!
Then live from New York, we gathered the open source observability community to hold our first ObservabilityCON in person. “It’s been really great to be doing [events] back in-person,” Grafana Labs CEO and co-founder Raj Dutt said during the opening keynote. “You really can’t beat the energy … We’re really glad to be doing it.”
8. Honored on the Forbes Cloud 100 list and more
We’d like to thank the Academy Community…
We were thrilled to be ranked #37 on the 2022 Forbes Cloud 100 list, which recognizes standout private cloud companies. Grafana Labs also landed on the Enterprise Tech 30 list, which is a platform for the startup community to identify and recognize the most promising companies in enterprise technology, while Grafana was named to InfoWorld’s list of best open source projects.
But one of the accolades we’re most proud of is being named to the Forbes list of America’s Best Startup Employers 2022. “There’s nothing — absolutely nothing — that this team can’t do together,” Grafana Labs CEO and co-founder Raj Dutt said during an all-hands meeting, calling the entire company “all smart, all heart.”

9. Announced strategic partnerships
In October, Grafana Labs announced a partnership with Isovalent, the creators of Cilium, to make it easy for platform and application teams to gain deep insights into the connectivity, security, and performance of the applications running on Kubernetes by leveraging the Grafana open source observability stack. Grafana Labs’ recent participation in Isovalent’s Series B funding round kicked off some joint engineering initiatives. There have been powerful solutions built to observe the health and performance of connectivity between cloud native applications using Cilium’s connectivity observability data with Grafana Labs’ LGTM open source observability stack. And in November, we launched the new Cilium Enterprise integration in Grafana Cloud.

We also announced a partnership with Google Cloud to enable observability of operational data associated with highly secure cloud workloads via integration with Google Distributed Cloud Hosted. This new partnership makes it simple for Google Cloud customers to observe their cloud workloads with Grafana Labs’ open source technologies, including Grafana for visualization and Grafana Loki for log aggregation. To learn more, go to our recent press release.
10. Scaled to more than 850 Grafanistas (and counting)
The Gra-family is growing!
In May, Grafana Labs brought together more than 600 Grafanistas in Whistler, British Columbia in Canada for Grafanafest, our first-ever company-wide celebration of the people behind our products. As a remote-first company, we recognize the value of in-person connections and were thrilled to host Grafana Labs employees from more than 40 countries representing all departments within the organization. We bonded, we skied, we danced, and we wore a lot of Grafana swag.
And we have continued to scale our teams. As we close out 2022, there are more than 850 Grafanistas — and we’re still looking for more. Check out the open positions at Grafana Labs on our Careers page and join our team in the new year!
So how can 2023 possibly top this year? We can’t wait to find out.
We want to hear from you about your observability practice! Fill out our short and easy observability survey. All responses will be kept anonymous, and you’ll be helping the community get a better understanding of the state of observability.