
Introducing Outlier Detection in Grafana Machine Learning for Grafana Cloud
Outlier Detection is now available as part of the Grafana Machine Learning toolkit in Grafana Cloud for Pro and Advanced users. With this feature, you can monitor a group of similar things, such as load-balanced pods in Kubernetes, and get alerted when some of them start behaving differently than their peers.

What does Outlier Detection do?
Modern apps deployed and scaled horizontally in Kubernetes can be a great way to keep up with the growth of your business. However, monitoring a large number of pods gets challenging as you battle with load balancers, noisy neighbors, resource contention, or other unexpected emergent properties of your systems. As you scale up, the complexity only increases.
But having a group of similar pods comes with an advantage, because it can provide a robust baseline of behavior to compare data against. In this particular use case, Outlier Detection makes use of this to highlight the needle(s) in the haystack of pods and identify issues so they can be resolved before they spread.
For example, Outlier Detection can identify when a pod has higher error rates compared to other pods in the same service, allowing you to investigate the root cause and take action to address the issue. This might involve scaling replicas, adjusting resource allocation, or moving pods to different nodes in the cluster.
How do I use Outlier Detection in Grafana Machine Learning?
Visit the Grafana Machine Learning app in Grafana Cloud and click Create an Outlier Detector. Enter a query that returns multiple series, say Kubernetes CPU metrics, for a given workload. For example:
(namespace, pod, container) (rate(container_cpu_usage_seconds_total{namespace="machine-learning"}[5m]))

With a suitable query, you will see the data visualized with outliers in yellow and a band of normality in blue. You can then use the sensitivity slider to adjust the thickness of this band to configure how extreme data points need to be to be labelled as outlier.
Once you are happy with the results, click Create and give the outlier detector a name and description and click Create Outlier. You can now view and edit this outlier detector in the Outlier Detectors tab in the Machine Learning app.
Grafana Alerting and Outlier Detection
To receive alerts when an outlier is detected in your data, use Grafana Alerting with an outlier detector. View the outlier detector you have created and click the Create Alert button. This will bring you to the familiar landing page for creating an alert with the appropriate query preconfigured. Choose a folder for the alert and click Save.
The default alert will notify you if at least one pod is misbehaving. For alerts based on a certain percentage of misbehaving pods, use an aggregated outlier-based alert rule. Refer to the Grafana Machine Learning documentation for more information.
Meet the Outlier Detection algorithms
We’re launching Outlier Detection with the option to choose between two different detection algorithms: DBSCAN and MAD. While they are both methods for identifying anomalous data in a series, each algorithm has its own characteristics and finds different types of outliers, so it is worth detailing their differences here.
- DBSCAN compares data for each timestamp to identify primary clusters and identify outliers. DBSCAN is best for series that move closely together.
- MAD compares the current behavior of the series to its historical behavior to identify significant deviations. MAD is best for series that reside in a stable band.
For example, if you have a metric whose series tend to have a stable trend and stay close together, you can use MAD to identify when one or more series breaks from this stable band (highlighted in blue in the dashboard below, with outliers highlighted in yellow).

DBSCAN, however, will not consider this situation an outlier as all series remain close together:
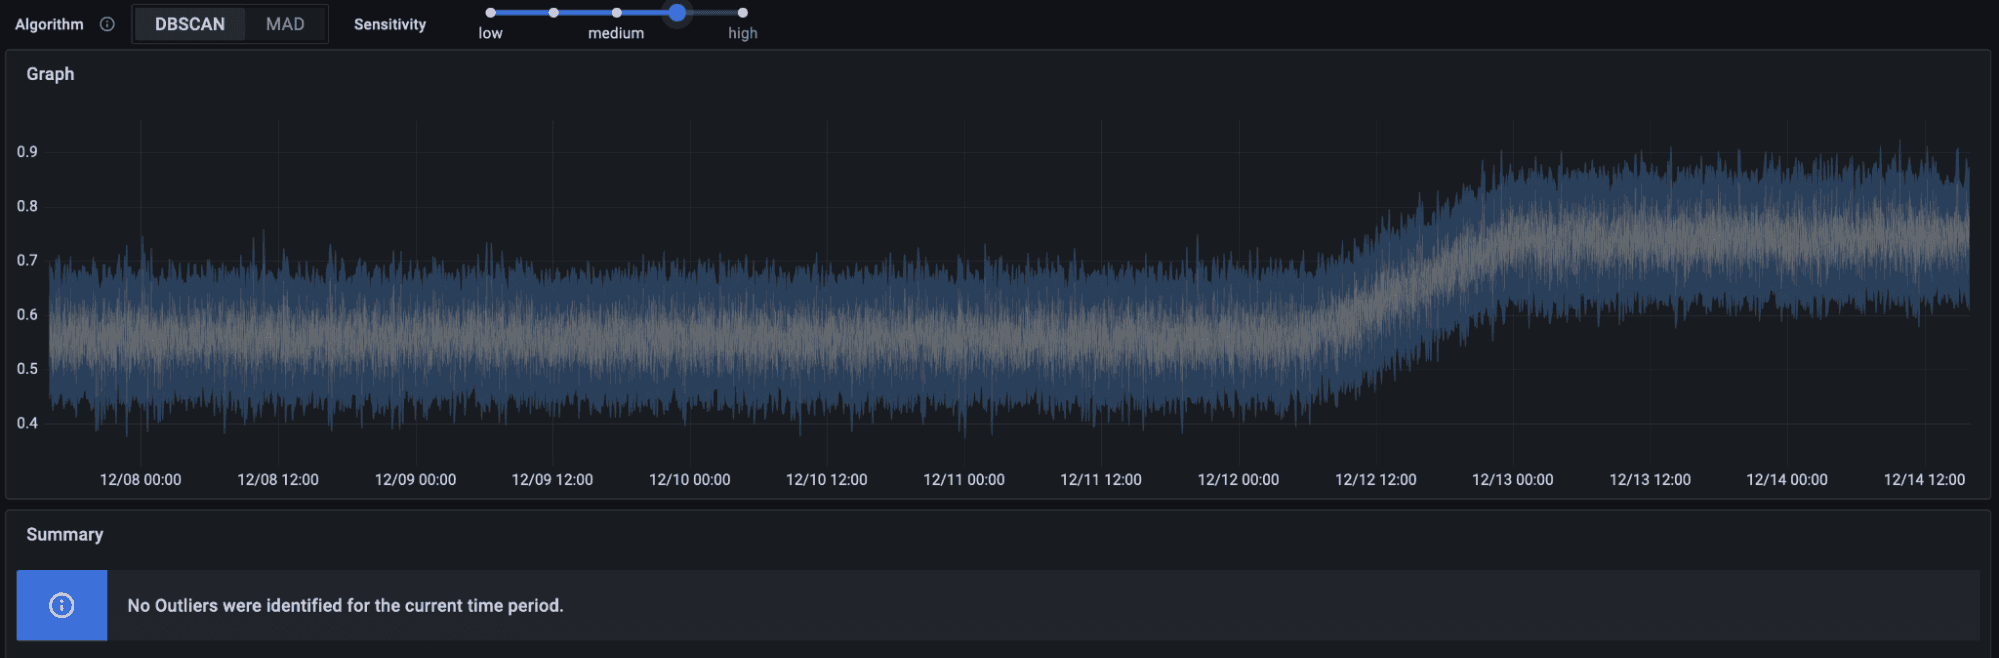
On the other hand, for a metric whose series remain only within a wide band (say it has a positive trend), MAD may struggle to reliably identify an anomaly that remains within the band. Note that only a few of points are noticed in the dashboard below:

DBSCAN, however, will notice the deviation from the norm far better in this case, and you can use a higher sensitivity to have more confidence in its findings:

Notice with DBSCAN, the normal band (highlighted in blue above) moves with the trend in your data.
We encourage you to explore your data with both algorithms and play with the sensitivity to determine which works best for you.
Try Outlier Detection in Grafana Machine Learning now
Outlier Detection in Grafana Machine Learning can be a valuable tool for identifying anomalous data in a series of similar pods. It’s available today as part of Grafana ML in Grafana Cloud for Pro and Advanced users. (If you’re not already using Grafana Cloud, sign up now for a free 14-day trial of Grafana Cloud Pro.)
If you have any questions, or would like to share your experience, please reach out in the #machine-learning channel of our Grafana Labs Community Slack workspace.
For more information, please refer to the Grafana Machine Learning documentation. Have fun exploring your data and discovering insights!
Grafana Cloud is the easiest way to get started with metrics, logs, traces, and dashboards. We have a generous free forever tier and plans for every use case. Sign up for free now!

