
How Grafana Alerting powers Torqata’s data health scorecard system
The tire sales industry is a fractured collection of hundreds of point of sales systems and thousands of auto shops and retailers. As a result, manufacturers and distributors lack critical visibility into how these products are sold.
SaaS startup Torqata aims to fix that.
“What you need to know about the tire industry, and really arguably the automotive industry, is it’s fairly antiquated with how it thinks of using data and insights from data to drive more efficient, better decisions,” said Torqata CTO AJ Pryor, who delivered a GrafanaCONline 2022 talk titled “How Grafana Unified Alerting powers Torqata’s data health scorecard system.”
But to make that a reality, Torqata needs to aggregate data from scores of sources with its streaming data ingestion platform. And to make that system scale, it needs to easily onboard new retailers so they can quickly get started sharing data and making better decisions. And that’s where Grafana comes in.
Note: Grafana Alerting (previously called Unified Alerting) has been updated with the release of Grafana 9. To learn all about the new and improved alerting experience, check out our Grafana Alerting documentation and our Grafana Alerting blog post exploring the latest updates.
Using Grafana alerts to accelerate onboarding
Torqata has built an alerting system to help position itself and its customers for success. Its data processing system is hosted on Google Cloud, using an inbound data ingestion layer, a microservice layer for ETL, and a persistent layer to store all that data (e.g., a data lake or data warehouse, depending on the needs). Data is received at least once a day, and the company uses BigQuery for data analysis. All of this data is then presented in Grafana for either quick snapshots or deeper analysis.
Ultimately, the goal is to expose the data to the end customer, which is delivered via an Angular web app that retailers can use to get insights on pricing and what they should have in stock. Newly added stores need to meet a few criteria with their data collection in order to benefit from this analysis, so the company built a scalable, extensible scorecard system that can understand existing data feeds and discover new ones as part of the onboarding process.
They use Grafana Alerting and multi-dimensional rules to achieve this, with a pass-fail toggle that aggregates a set of attributes in Grafana to determine the overall health of the system with a single query.
“If a new data feed arrives, it will naturally and organically be created by this multi-dimensional alerting,” said Pryor. “What I would not like to do is have to go in and register a new customer and also then attach these alerts. I want to write it once and have it work forever and scale as the customer scales.”
These attributes are stored as a single record, and they use a custom webhook that’s tied through notification channels and policies in order to extract and store those records in a database. The team can then extend this to multiple checks and add conditions as needed. For example, if they want to know if a data feed has been shut off, they can write a query to multiple data sources — Graphite, PostgreSQL, or Prometheus connected via Grafana plugins — to know how many days have lapsed since the last file was received.
Torqata, which self-hosts Grafana OSS, has been using this system in production for over a year. They now manage hundreds of thousands of alerts every few minutes without any issues.

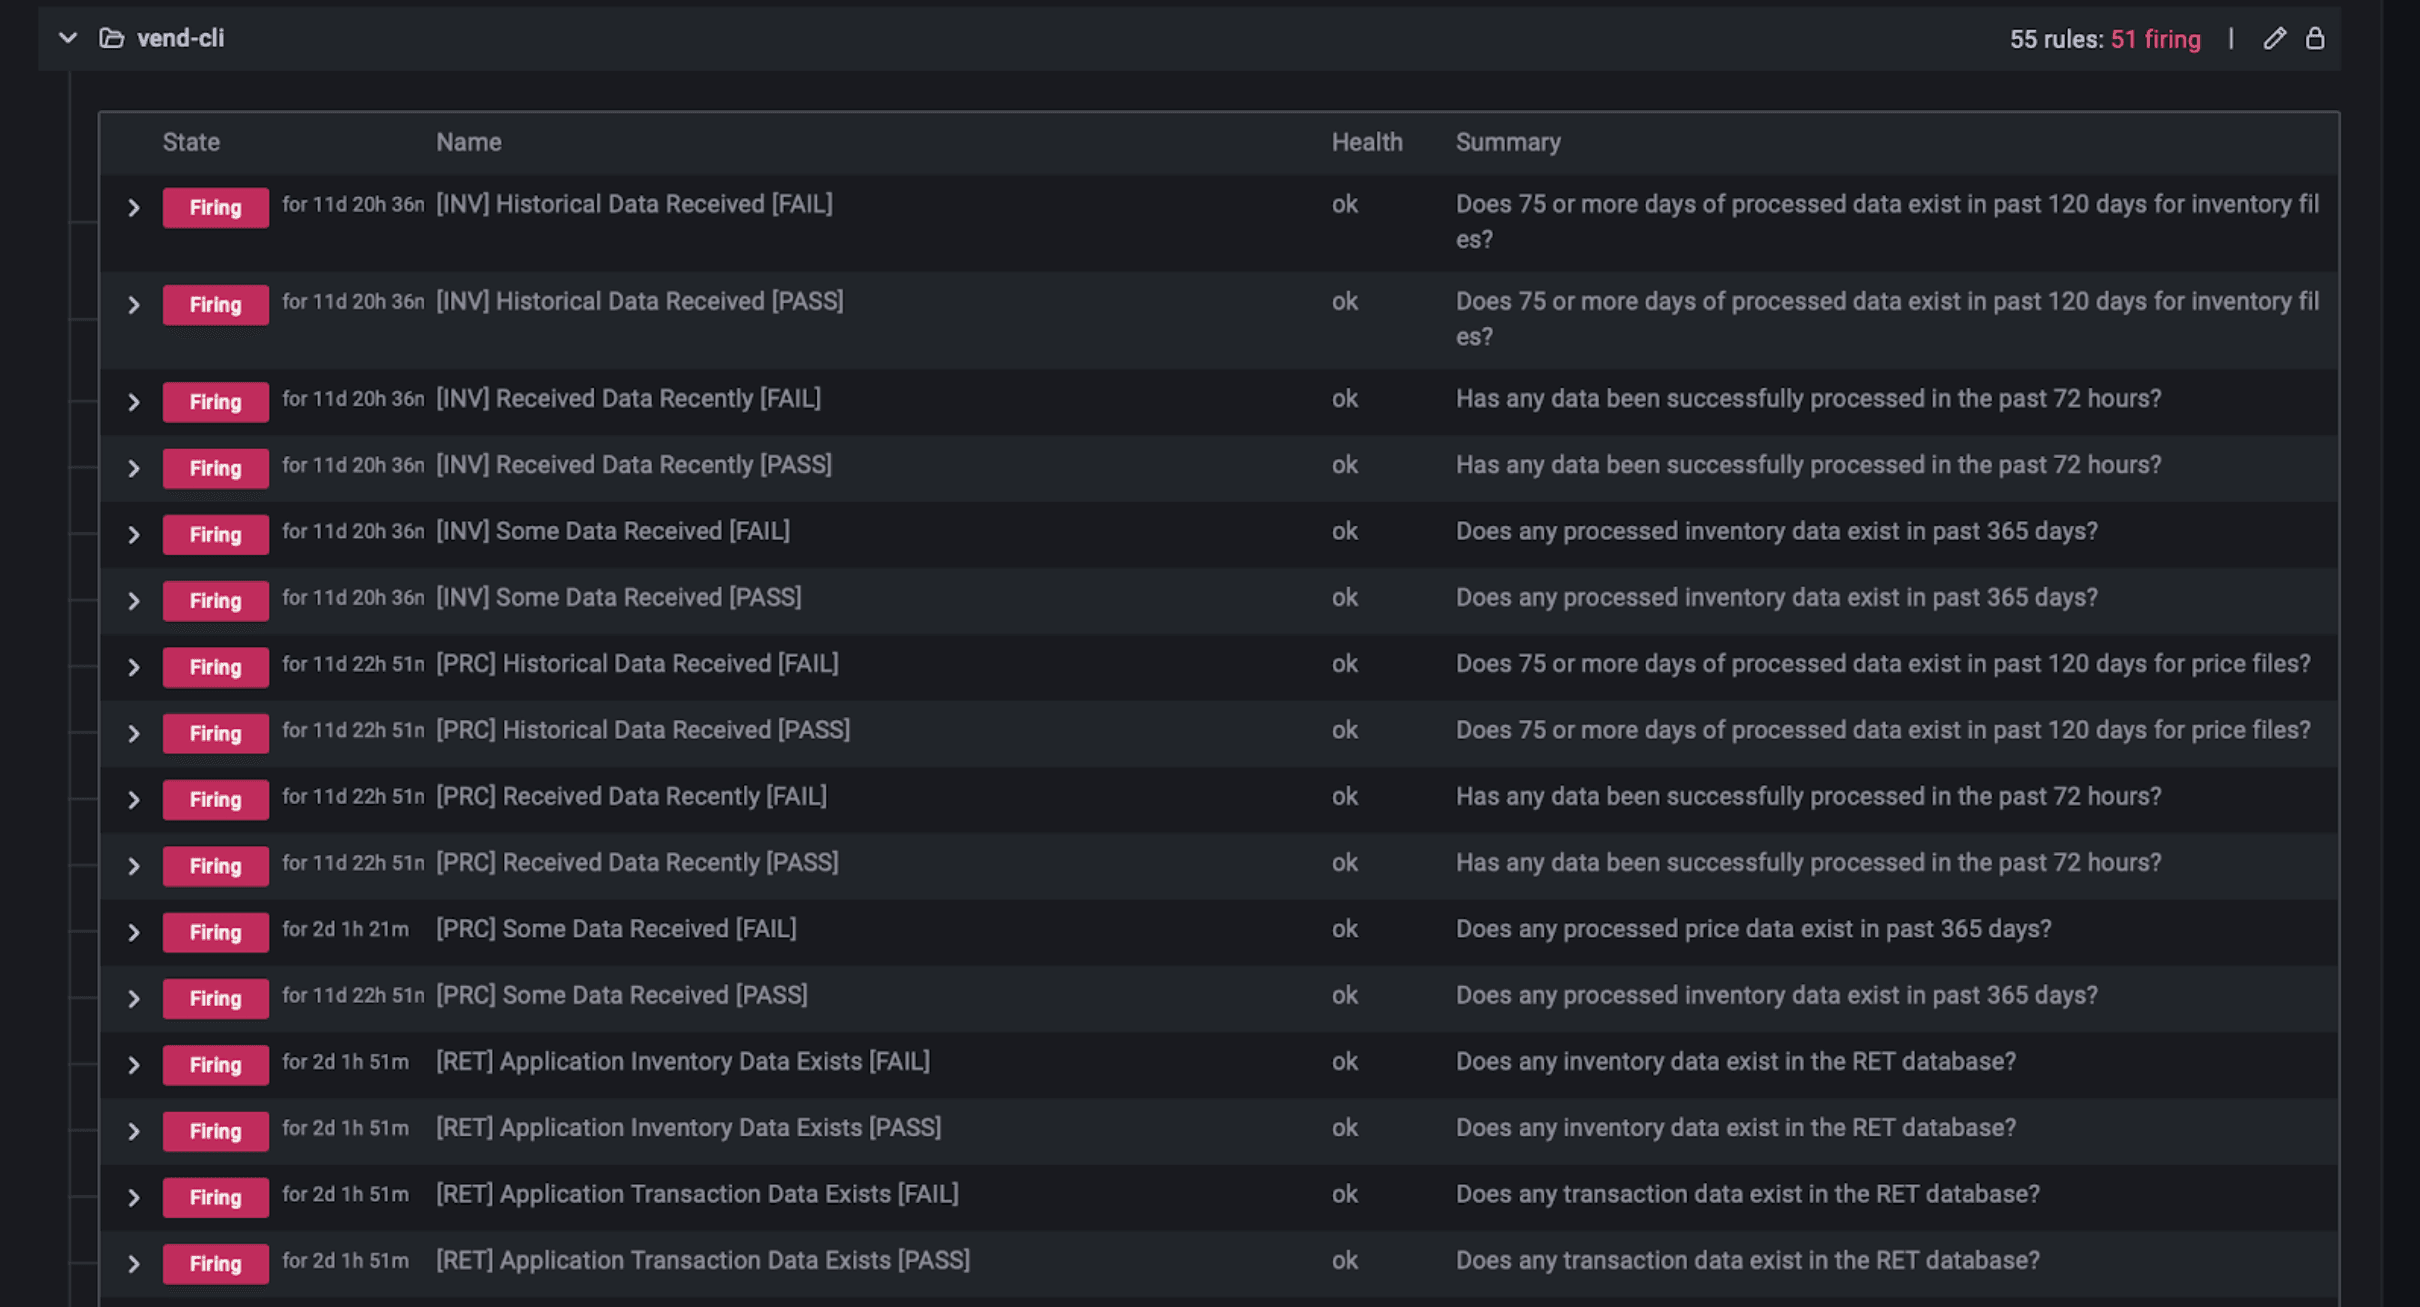
Anatomy of a scorecard
The Customer Integrations and Engagement team maintains and extends the initial architecture for Torqata’s customer onboarding scorecard. The scorecard can be viewed in two panels in Grafana: One that provides a high-level aggregated performance gauge derived by the alert conditions, and another to drill down into store-specific performance metrics.
“Grafana Alerting has allowed our team to create this automated onboarding reference system that we can scale as we grow, and it has reduced our customer onboarding process by an order of magnitude,” said Lead Data Engineer Marie-Claire Kore. “Our ability to connect and query multiple sources enables a holistic view into the data layer of our applications and provides critical observability not only the availability of the data but how it will perform in our apps.”
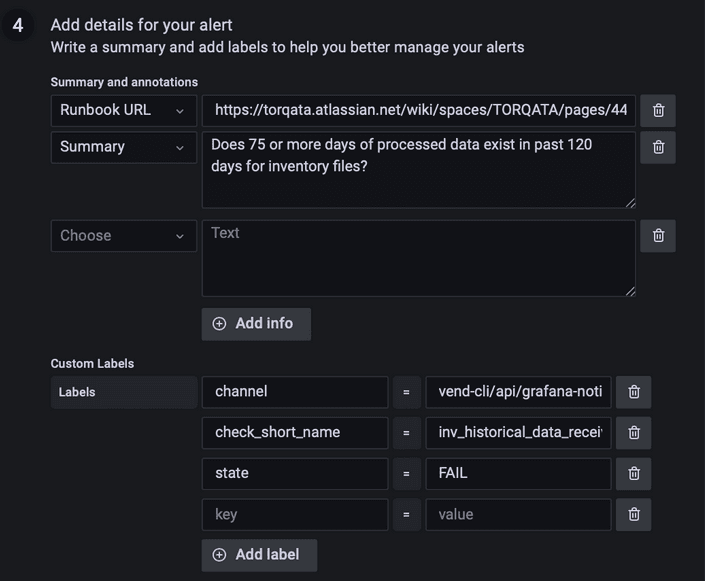
The system is designed to simultaneously signal issues with data quality and direct admins to the most efficient act of remediation. This helps eliminate downtime and fix issues before they ever get to end users and consists of three parts:
- Rule type. Groupings and names provide a quick glance into the relevance of an alert and help designate priority.
- Query and conditions. Multi-dimensional queries, along with wildcard notations, help the team parameterize a single query and apply alert conditions to all store locations within the Torqata platform.
- Details. Alerts can be tailored to automatically send the necessary information to the designated channels.
Ultimately, this helps Kore and her team automate onboarding, prioritize where to intervene, and measure the success of past actions. In this way, Grafana helps with more than just debugging; it acts as an extension of Torqata’s service and helps the company proactively communicate and tailor the experience for its end users.
“We know the customer and the data better, allowing us to be more creative and add the advantage for our internal stakeholders to extend that benefit to our customers,” Kore said.
Watch the full session to learn more about Torqata’s alerting system built with Grafana, including lessons learned from its implementation process. And check out all our sessions from GrafanaCONline 2022, which are now available on demand.

