The only Helm chart you need for Grafana Loki is here
The community has spoken, six Helm charts is not enough! We agree!
In all seriousness though, six charts is simply too many to maintain. And while it might sound counterintuitive, that’s why we are announcing a new Helm chart. By focusing on the “Grafana Labs way" to run Grafana Loki using Helm, we believe this will help us and the community concentrate our Helm efforts into a single chart.
This new chart is released under grafana/loki at Helm version 3 or higher. It replaces the old grafana/loki chart, which only supported running Loki in single-binary mode. It’s also the successor to the grafana/loki-simple-scalable chart. The new chart supports both scalable (formerly called “simple scalable” or SSD) and single-binary deployment modes.
Going forward, this will be the only Helm chart we use to run any Helm-deployed Loki clusters here at Grafana Labs. We believe there are several superior features to this new chart, which we’ll elaborate on below, but here’s the biggest benefit: Users will know the best way to get started with Loki, they’ll know which chart to install, and they’ll know it’s the one supported by the team at Grafana Labs.
How to get started
To get up and running quickly, there is an installation guide as well as videos below for open source and Enterprise installations. If you are migrating from an existing Helm chart, please see these migration guides from either v2 or lower of the grafana/loki Helm chart, the grafana/loki-simple-scalable chart, or one of our distributed Helm charts (grafana/loki-distributed and grafana/enterprise-logs).
New features for monitoring Loki
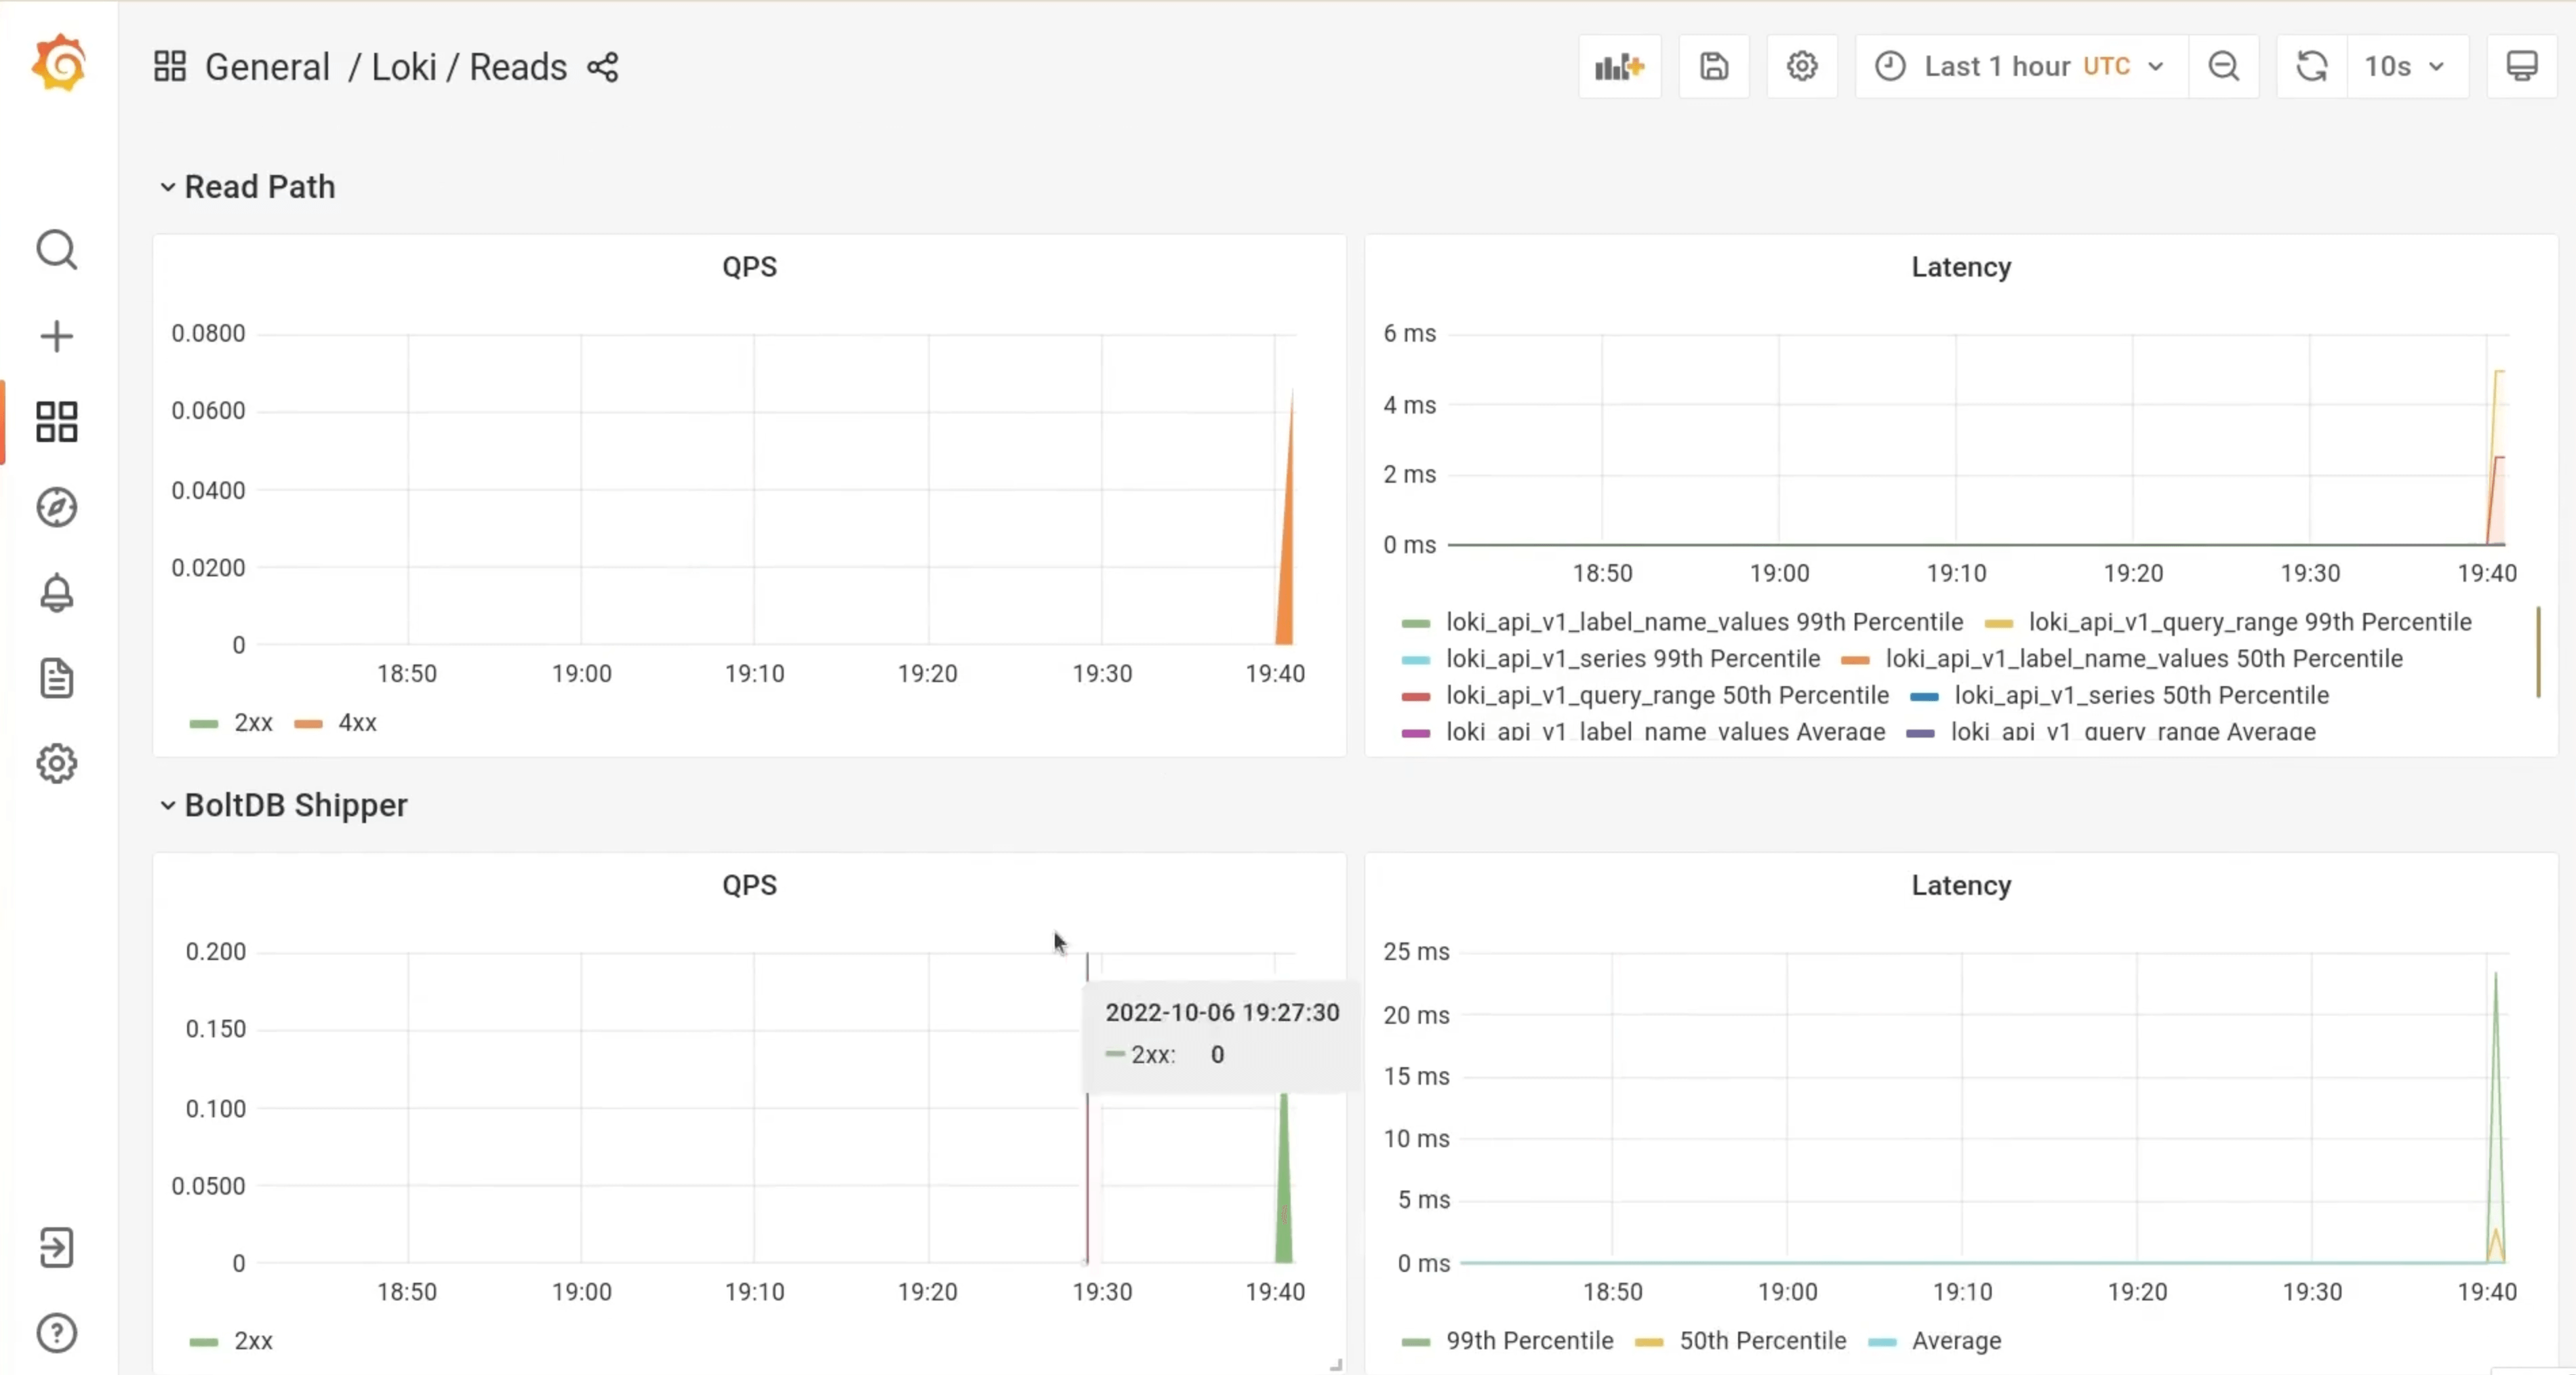
There are some great new features in this chart. It ships with a Loki Canary and Self-Monitoring on by default. The Self-Monitoring, which will automatically set up scraping for logs and metrics coming out of Loki, also comes complete with the same dashboards we use to monitor Loki at Grafana Labs. Open source and Enterprise deployments are now deployed using the same Helm chart, allowing both experiences to immediately benefit from new features. Enterprise users will also benefit from a built-in provisioner, allowing tenants to be provisioned at installation time via the Helm chart.
There’s supposed to be a video here, but for some reason there isn’t. Either we entered the id wrong (oops!), or Vimeo is down. If it’s the latter, we’d expect they’ll be back up and running soon. In the meantime, check out our blog!
Loki Canary
The Loki Canary is crucial to our Loki operations at Grafana Labs. This component emits and periodically queries for logs, making sure that Loki is ingesting logs without any data loss. When something is wrong with Loki, the Canary often provides our first indication. Thanks to the Self-Monitoring features also included with the new chart, this component is deployed and configured by default, making it easier than ever to use the Loki Canary to monitor a Loki deployment.
Self-Monitoring
Probably the most exciting feature of the new chart is the Self-Monitoring features that come enabled out of the box. The new chart ships with a Grafana Agent as well as the necessary LogsInstance, PodLogs, and ServiceMonitor resources to automatically configure Loki to monitor itself. By default, Loki is configured to send its own logs (including those of the Canary) to itself. This can be changed to use a Cloud Logs instance, which would be preferable for a production installation. The Helm chart also includes the necessary ServiceMonitor and MetricsInstance definitions to allow Loki’s metrics to be automatically picked up by a Prometheus Operator deployment, or via a manually provided Prometheus, Mimir, or Cloud Metrics URL.
In addition to resources that allow for the automatic discovery and scraping of Loki’s metrics and logs, the new Helm chart also ships dashboards that use these metrics and logs to provide production-ready observability into the Loki cluster. These are the same dashboards we use to run Loki at Grafana Labs and that we publish in our loki-mixin.

Helm test
Thanks to the Self-Monitoring features that come pre-packaged in the new chart, we are now able to provide an end-to-end Helm test. The test, which you can run using the helm test command, requires you to specify the address of the Prometheus or Mimir instance that is collecting the metrics from Loki. Once configured, it will query Prometheus to make sure the Loki Canary is emitting logs, and that no logs have been dropped, thus ensuring a correctly functioning and configured Loki deployment.
How to deploy Helm with Grafana Enterprise Logs
There are some great new benefits for those using Helm to deploy Grafana Enterprise Logs (GEL) as well. In the past, many enterprise users used grafana/enterprise-logs, which was a wrapper around grafana/loki-distributed. This was problematic for a few reasons. First of all, changes and updates were always delayed, as they had to first be made to grafana/loki-distributed, the version of which then had to be updated in grafana/enterprise-logs. Second, since they were separate charts, the templates in the distributed chart couldn’t always access values in the enterprise wrappers, making it harder to enable certain configurations. By putting the open source and Enterprise versions side by side in the same chart, both of these issues have been alleviated.
The new chart also includes a new tenant provisioner. In addition to automatically provisioning a tenant for the Canary and Self-Monitoring, this also allows GEL users to specify a list of tenants to get provisioned during the Helm installation itself. This streamlines installations, negating the need for a follow-up script or manual process to provision tenants after GEL is installed.
There’s supposed to be a video here, but for some reason there isn’t. Either we entered the id wrong (oops!), or Vimeo is down. If it’s the latter, we’d expect they’ll be back up and running soon. In the meantime, check out our blog!
Why we added a new Helm chart
Now that we’ve shown you all the benefits of the new Helm chart, let’s take a step back. The history of Loki Helm charts goes back before my time as a maintainer, but I’ll do my best to characterize how we ended up with six different charts.
The existing Helm charts are largely a product of our fantastic community, and members of the community contributed to different charts due to different use cases. For example, some ran Loki as a single binary, while others wanted a full-stack Grafana plus Loki chart experience. This was great from the perspective of flexibility, but it made it tough for new users to figure out which chart to start off with.
Our new chart is entirely based on the work done in the community charts that preceded it and couldn’t exist without the help of our community. We hope that by creating a new chart that is hosted in the Loki repo itself, it will be clear to newcomers what the “suggested” way to get started with Loki via Helm is. We of course encourage the community to continue to create and maintain charts that work for their use cases, but we plan to play a less active role in those other charts as we focus our energy on this new one.
Give us your feedback
With such a big overhaul, we expect there to be small hiccups and use cases we may not have considered, so we really appreciate any and all feedback you might have. Please direct issues and pull requests to the grafana/loki repo and let us know your experience in the Grafana community Slack channel.
Grafana Cloud is the easiest way to get started with metrics, logs, traces, and dashboards. We have a generous free forever tier and plans for every use case. Sign up for free now!
If you’re not already using Grafana Cloud — the easiest way to get started with observability — sign up now for a free 14-day trial of Grafana Cloud Pro, with unlimited metrics, logs, traces, and users, long-term retention, and access to one Enterprise plugin.


