
A guide to cyber threat hunting with Promtail, Grafana Loki, Sigma, and Grafana Cloud
Fact: The Security Operations team at Grafana Labs loves logs.
They are a key pillar of observability for many reasons, such as how they are stuffed full of details to help us diagnose the “why?” when things go wrong. This is especially true when the information pertains not to a series of unfortunate events, but instead to an adversary trying to cause us harm. In this case, logs can come to the rescue and help us answer a (more worrisome) question: Have my systems been compromised by a deliberate attack?
Yet searching logs for indications of compromise (IOCs) is not an easy job. New tactics, techniques, and procedures (TTPs) are constantly appearing and attackers are often careful about hiding their activities.
One project to help security teams identify suspicious or even malicious activity is the open source Sigma project. Sigma is a generic structured format for sharing methods for identifying such activity in log files. In their own words, Sigma is for log files what Snort is for network traffic and YARA is for files. The passionate Sigma community is constantly creating and expanding on a huge library of rules for many systems, including Windows, Linux, MacOS, and many other products.
But Sigma rules cannot be used to directly query your logs. To do that, you need a translator, or a backend library in Sigma terms, that can help facilitate the conversion of the Sigma rule into a relevant query language, such as Grafana Loki’s LogQL.
And that’s exactly what we in the Security team have been developing. Building on the pySigma project, we have created a pySigma Grafana Loki backend, which can take the Sigma rules you are interested in searching for and produce a LogQL query that you can use to find interesting or suspicious activity on your infrastructure and services.
So, how do you get started searching your logs for intrusions? Well, you need to make sure the right logs are going into Grafana Loki. The majority of Sigma rules target Windows log data, so we’re going to show you a step-by-step guide on how you can generate log data using Sysmon, collect the data with Promtail, store the data in Loki, and use Sigma rules to query for them in Grafana Cloud.
Logging installation & configuration
First off, you need to have one of more Windows devices that are generating useful log data. The Sysmon project is commonly used in this context, and it is especially relevant when combined with a strong configuration, such as this project, maintained by everyone’s favorite Twitter-celebrity SwiftOnSecurity (no relation to Taylor … we think).
Download both Sysmon and the configuration file, then decompress the Sysmon installer(s) into an appropriate location and move the configuration file into the same folder. You can then run the following from an Administrator terminal to install the Sysmon service. (Use Sysmon.exe if you’re still on a 32-bit Windows device!) After accepting the Sysmon terms and conditions, this will set up a persistent Sysmon service that uses the specified configuration.
> cd path\to\Sysmon\folder\
> .\Sysmon64.exe -i .\sysmonconfig-export.xml

System Monitor v14.12 - System activity monitor
...
Sysmon64 started.
With Sysmon installed, you can quickly check that events are now being logged by opening the Windows Event Viewer. Using the Event Viewer tree on the left-hand side, navigate to Applications and Services Logs > Microsoft > Windows > Sysmon > Operational, and you should see relevant Sysmon events are now appearing in your logs.
Aggregation set up, installation, and configuration
At this point, you have the log data being generated and stored in Windows. Now you need to get that data into Grafana Loki.
In this blog, we’ll be using Promtail to transfer this data into Grafana Cloud, but of course this could also be done using self-hosted Grafana and Loki instances. If you don’t already have a Grafana Cloud instance, you can create a free account and walk through the (easy!) steps to create your very own Grafana stack.
With your Grafana and Loki instances up and running, you’ll need to install and configure Promtail so it can securely store the data it collects in Loki. Installing Promtail is a relatively simple process: You can download the latest release from the Loki Github repository. Under the latest release, expand the Assets list and download the relevant version of Promtail (we used promtail-windows-amd64.exe.zip, from the latest 2.7.1 release). Simply decompress the downloaded file into a folder of your choice.
For the Promtail configuration, Grafana Cloud can automatically create a template configuration file for you. From within your Grafana Cloud instance, click on the Integrations and Connections lightning bolt on the left hand menu, then the Custom data button at the top of the page, and then the Hosted logs from the options below. Choose a name for your API key and click on the Create API key button, and a sample config.yaml file will then immediately appear, which will look something like this:
server:
  http_listen_port: 0
  grpc_listen_port: 0

positions:
  filename: /tmp/positions.yaml

client:
  url: https://$API_user:$API_key@logs-prod-008.grafana.net/api/prom/push

scrape_configs:
- job_name: system
  static_configs:
  - targets:
      - localhost
    labels:
      job: varlogs
      __path__: /var/log/*.log
Copy and save the generated text in a file called config.yaml in the same folder that you extracted Promtail into. You will likely have noticed that this template includes configuration to scrape Linux log data, so our next job will be changing that to collect the Windows Sysmon data instead. With a text editor of your choice, replace the lines starting from scrape_configs: with the following YAML configuration:
scrape_configs:
- job_name: windows
  windows_events:
    use_incoming_timestamp: false
    bookmark_path: "./bookmark.xml"
    eventlog_name: "Microsoft-Windows-Sysmon/Operational"
    labels:
      job: windows
With that, your Promtail configuration should be ready. Open an Administrator terminal window in the folder you extracted the Promtail into and start it with the following command:
> & .\promtail-windows-amd64.exe '-config.file' '.\config.yaml'Assuming all has gone well, after a few moments you should see some output in your terminal that ends with something like this:
level=info ts=<DATE> caller=main.go:171 msg="Starting Promtail" version="(version=HEAD-1b627d8, branch=HEAD, revision=1b627d880)"
level=warn ts=<DATE> caller=promtail.go:220 msg="enable watchConfig"
Ensuring you keep that Promtail process running, and do a couple of actions to generate some log data (e.g., open a webpage or two, run a couple of commands in a different terminal), then you can head back to your Grafana Cloud instance to test that your log data is arriving.
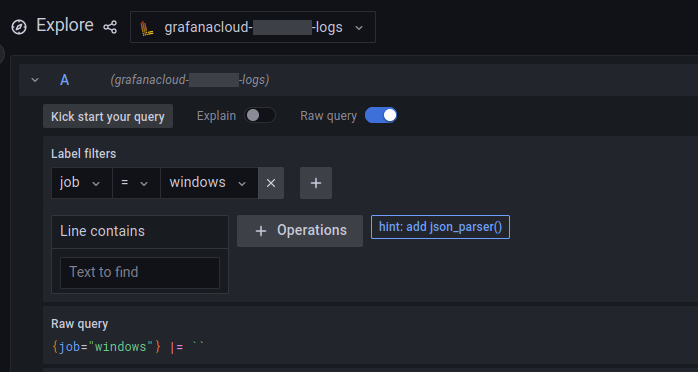
Within your Grafana instance,
- Go to the Explore page (the compass icon on the left-hand menu)
- Select the relevant Loki instance from the top-left corner pull-down menu (named grafanacloud-$instance_name-logs)
- Use the Label filters pull-down menus to create a search for entries where the job label is equal to windows
- Click on the Run query button in the top right
If all goes well, you should see some JSON-encoded Windows Sysmon log data appearing soon after.
Searching Grafana Loki with Sigma
At this point, you should now have Windows Sysmon logs being generated, a Grafana stack configured, and the event data ready in Loki. You are now ready to start searching those logs!
To convert Sigma rules into Loki queries, you’ll need to have Python & Git installed, which you can then use to install the sigma-cli tool. You’ll then download the Sigma rules that you’re interested in searching for, convert one of them using sigma-cli, and run the searches in Loki, validating that they work in the process.
First off, make sure you have up-to-date versions of Python (version 3.8 or later) and Git installed, adding both to your PATH so they can be used easily in the following steps. If you have to install these now, you may need to start a new terminal afterwards to ensure that your PATH is updated appropriately, and installing Python for the first time may necessitate a full reboot for it to work correctly.
With both Python and Git installed, installing the sigma-cli with Loki support can be done with the following command:
> pip install git+https://github.com/grafana/sigma-cli.gitTo test that this worked, you should be able to run the following command to see the formats command-line sigma can convert into:
> sigma list targets
| Identifier | Target query language | Processing pipeline required |
|---|---|---|
| splunk | Splunk | Yes |
| insightidr | Rapid7 InsightIDR | No |
| qradar | IBM QRadar | No |
| elasticsearch | Elasticsearch Lucene | Yes |
| opensearch | OpenSearch Lucene | Yes |
| loki | Grafana Loki | No |
If all has gone well, you should see Loki at the bottom of the table.
With the sigma-cli tool installed, you need some rules to convert. The largest public repository of Sigma rules is maintained by the SigmaHQ community on GitHub and can be downloaded using Git:
> git clone https://github.com/SigmaHQ/sigma.gitFor this blog post, we’ll just show how a specific Sigma rule (looking for suspicious use of the attrib command to potentially hide files in key directories) can be converted into a Loki query and find relevant entries in the Sysmon log data:
> sigma convert -t loki -p sysmon -p loki_promtail_sysmon sigma\rules\windows\process_creation\proc_creation_win_attrib_system_susp_paths.yml
Parsing Sigma rules [####################################] 100%
{job=~"eventlog|winlog|windows|fluentbit.*"}
| json | label_format Message=`{{ .message | replace "\\" "\\\\" | replace "\"" "\\\"" }}`
| line_format `{{ regexReplaceAll "([^:]+): ?((?:[^\\r]*|$))(\r\n|$)" .Message "${1}=\"${2}\" "}}`
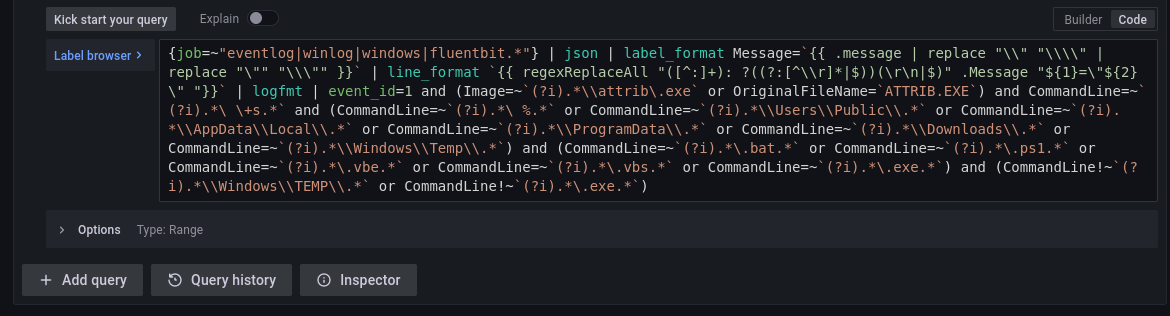
| logfmt | event_id=1 and (Image=~`(?i).*\\attrib\.exe` or OriginalFileName=`ATTRIB.EXE`) and CommandLine=~`(?i).*\ \+s.*` and (CommandLine=~`(?i).*\ %.*` or CommandLine=~`(?i).*\\Users\\Public\\.*` or CommandLine=~`(?i).*\\AppData\\Local\\.*` or CommandLine=~`(?i).*\\ProgramData\\.*` or CommandLine=~`(?i).*\\Downloads\\.*` or CommandLine=~`(?i).*\\Windows\\Temp\\.*`) and (CommandLine=~`(?i).*\.bat.*` or CommandLine=~`(?i).*\.ps1.*` or CommandLine=~`(?i).*\.vbe.*` or CommandLine=~`(?i).*\.vbs.*` or CommandLine=~`(?i).*\.exe.*`) and (CommandLine!~`(?i).*\\Windows\\TEMP\\.*` or CommandLine!~`(?i).*\.exe.*`)This tells Sigma to output a Loki format query (-t loki), using two different pipelines (-p) to convert the rule’s field names into the correct fields that are produced by Promtail. The output query starting with {job=~, can then be copied.
To use this query to do a search, return to the Explore page in Grafana Cloud and change the query mode from Builder to Code using the toggle on the right-hand side. Paste the generated query into the text box, as shown below, overwriting any existing query, and again use the top-right Run query button to search your logs for it. Assuming nothing unusual is happening in your Windows environment, you should find no results are brought back for this query.
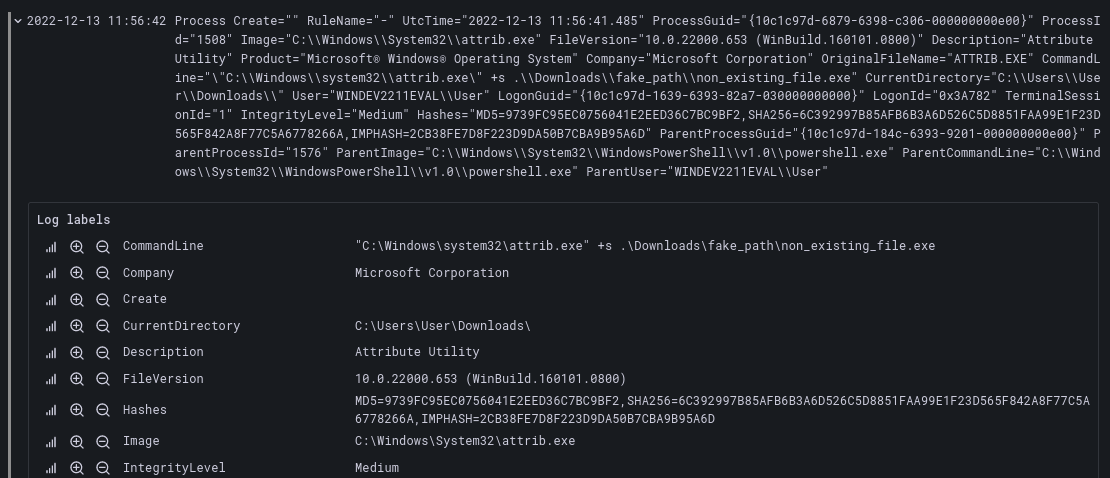
But we can easily validate that the query does work (though we wouldn’t necessarily recommend doing so on a production system). Return to your Windows terminal, double-check that your Promtail command is still running, and run the following command to generate some log data of interest (using a path that doesn’t exist will still generate a relevant Sysmon log entry):
> attrib +s .\Downloads\fake_path\non_existing_file.exeAfter a few seconds, giving the log data time to reach Grafana Cloud, re-run your previous test query with the Run query button, and if all has gone well, the log entries you just generated should appear as results.
What’s next for Sigma and Grafana Loki
In this blog, we’ve explored the concepts around identifying suspicious and intrusion activity in log data and introduced the Sigma format as an approach to sharing rules for detecting said activity. We demonstrated an end-to-end process of how security-relevant Windows log data can be generated with Sysmon, plus how Promtail can collect that log data and push it onto Loki running in Grafana Cloud. We’ve also shown how Sigma rules can now be converted into Loki queries, which can then be used to search those logs and identify potential intrusions in your infrastructure.
In future posts, we’ll be showing you how Sigma rules can be used with Grafana Alerting to notify you when they are triggered. We will also explore a range of other systems that Grafana Loki and Sigma can be used in to monitor for security incidents.
We’re also very interested in hearing your experiences with the tools we’ve introduced here! If you have any comments or suggestions, feel free to drop them into the Grafana community forums, in the Grafana Labs community Slack, or in our GitHub repository.
Grafana Cloud is the easiest way to get started with metrics, logs, traces, and dashboards. We have a generous free forever tier and plans for every use case. Sign up for free now!