
A complete guide to managing Grafana as code: tools, tips, and tricks
We all know about the great things Grafana dashboards can do, and configuring them as code makes it possible to get even more out of them.
These days, Grafana resources can mostly be managed as code in a declarative manner, which enables code review, code reuse, and in general, better workflows.
This guide presents a few as code tools you can use to declaratively manage Grafana resources, plus some tips and tricks on how to incorporate them efficiently into your own use cases.
Some of the tools we are covering in this guide include Grafana Terraform provider, Grafana Ansible collection, Grafonnet for dashboards, Grizzly, Grafana APIs with GitHub Actions, and Crossplane.
Grafana Terraform provider
Grafana administrators can manage dashboards and alerts, add synthetic monitoring probes and checks, manage identity and access, and more using the Terraform provider for Grafana.
A sample Terraform configuration for creating a dashboard looks like this:
resource "grafana_dashboard" "metrics" {
  config_json = jsonencode({
    title   = "as-code dashboard"
    uid     = "ascode"
  })
}
To get started, see the quickstart guides for the Grafana Terraform provider or check out the provider’s documentation.
Who is this recommended for?
Grafana Terraform provider is better suited for users who are already using Terraform for non-Grafana use cases.
For users currently looking to manage the entire Grafana ecosystem of resources on either Grafana Cloud or OSS deployments of Grafana, it’s best to use the Grafana Terraform provider because it also supports the most Grafana resources compared to Grafana’s other as code solutions.
Known limitations
Managing dashboards isn’t the simplest process — users have to work with long JSONs, which can become difficult to review and update as well. Grafonnet can help with generating dashboard JSONs that can be used in Terraform, but Grafonnet requires knowing Jsonnet, so that can be unappealing to some users.
Grafana Ansible collection
Resources for configuration management are available for Grafana through the Ansible collection for Grafana. It can be used to manage a variety of resources, including folders, cloud stacks, and dashboards. Users can programmatically manage resources on Grafana that aren’t currently part of the Grafana Ansible collection by writing Ansible playbooks that use the HTTP APIs to manage resources for Grafana.
Note: The Grafana Ansible collection is in the process of being merged with the community.grafana Ansible collection.
A sample Ansible configuration for creating a dashboard looks like this:
- name: dashboard as code
  grafana.grafana.dashboard:
    dashboard: {
      "title": "as-code dashboard",
      "uid": "ascode"
    }
    stack_slug: "{{ stack_slug }}"
    grafana_api_key: "{{ grafana_api_key }}"
    state: present
Who is this recommended for?
Like Terraform, the Grafana Ansible collection is better suited for people already using Ansible for non-Grafana use cases. On top of that, the collection only works for Grafana Cloud right now, so it makes the most sense for Grafana Cloud customers who are looking to manage resources declaratively using Ansible.
Known limitations
As of writing, the Grafana Ansible collection only works for Grafana Cloud and only supports eight resources: API keys, cloud stacks, plugins, dashboards, folders, data sources, alert contact points, and notification policies. That can be a drawback for users looking to manage the entire Grafana ecosystem as code with Ansible. As with Terraform, dashboard building is not the simplest process.
Grizzly
Grizzly is a command line tool that allows you to manage your observability resources with code. Grizzly supports Kubernetes-inspired YAML representation for the Grafana resource, which makes it easier to get familiar with. Grizzly supports moving dashboards within Grafana instances and also retrieves information about already provisioned Grafana resources. Grizzly currently supports:
- Grafana dashboards/dashboard folders
- Grafana data sources
- Prometheus recording rules/alerts in Grafana Cloud
- Grafana Cloud Synthetic Monitoring checks
Grizzly can also deploy dashboards built in Jsonnet using Grafonnet. (Learn more in the Grafonnet documentation.)
A sample Kubernetes-style Grizzly configuration for creating a dashboard looks like this:
apiVersion: grizzly.grafana.com/v1alpha1
kind: Dashboard
metadata:
    name: as-code-dashboard
spec:
    title: as-code dashboard
    uid: ascode
Who is this recommended for?
Grizzly is best suited for users who are either using Jsonnet to manage Grafana resources or prefer a Kubernetes-style YAML definition of their Grafana resources.
Known limitations
Grizzly currently doesn’t support Grafana OnCall and Grafana Alerting resources.
Grafana Crossplane provider
Grafana Crossplane provider is built using Terrajet and provides support for all resources supported by the Grafana Terraform provider. It enables users to define Grafana resources as Kubernetes manifests and would also help users who build their GitOps pipelines around Kubernetes manifests using tools like ArgoCD.
To get started with the Grafana Crossplane provider, install Crossplane in the Kubernetes cluster and use this command to install the provider:
kubectl crossplane install provider grafana/crossplane-provider-grafana:v0.1.0
During installation of the provider, CRDs for all the resources supported by the Terraform provider are added to the cluster so users can begin defining their Grafana resources as Kubernetes custom resources. The Crossplane provider ensures that whatever is defined in the custom resource definitions is what is visible in Grafana UI. If any changes are made directly in the UI, the changes will be discarded when the provider resyncs. This helps ensure that whatever is defined declaratively in the cluster will be the source of truth for Grafana resources.
To get started, refer to the examples folder in the Grafana Crossplane repository.
A sample Kubernetes custom resource definition for creating a dashboard looks like this:
apiVersion: grafana.jet.crossplane.io/v1alpha1
kind: Dashboard
metadata:
  name: as-code-dashboard
spec:
  forProvider:
    configJson: |
      {
        "title": "as-code dashboard",
        "uid": "ascode"
      }
  providerConfigRef:
    name: grafana-crossplane-provider
Who is this recommended for?
The Grafana Crossplane provider is good for existing Crossplane users looking to manage Grafana resources from within Kubernetes and as Kubernetes manifests for the GitOps pipelines.
Known limitations
The Crossplane provider is dependent on having the Crossplane CLI and Crossplane installed in the Kubernetes cluster. This dependency can be unattractive for non-Crossplane users. It is also in an alpha stage, so it has not reached a stable state yet.
Kubernetes Grafana Operator
Grafana Operator is a Kubernetes operator to provision and manage Grafana and its resources using Kubernetes Custom Resources. It is a Kubernetes-native solution built by the Grafana community. It can also take dashboards built in Grafonnet as a source of dashboard configuration.
Refer to the documentation section in the grafana-operator repository to get started.
A sample Kubernetes configuration for creating a dashboard using the Grafana operator looks like this:
apiVersion: integreatly.org/v1alpha1
kind: GrafanaDashboard
metadata:
  name: simple-dashboard
  labels:
    app: grafana
spec:
  json: >
    {
      "title": "as-code dashboard",
      “uid” : “ascode”
    }
Who is this recommended for?
The Grafana-operator works well for users looking to manage Grafana resources from within Kubernetes and as Kubernetes manifests for the GitOps pipelines.
Known limitations
This only works with Grafana OSS so Grafana Cloud users won’t be able to use it. Also, Grafana-operator does not have a Helm chart, which can be an issue for orgs having pipelines built around Helm.
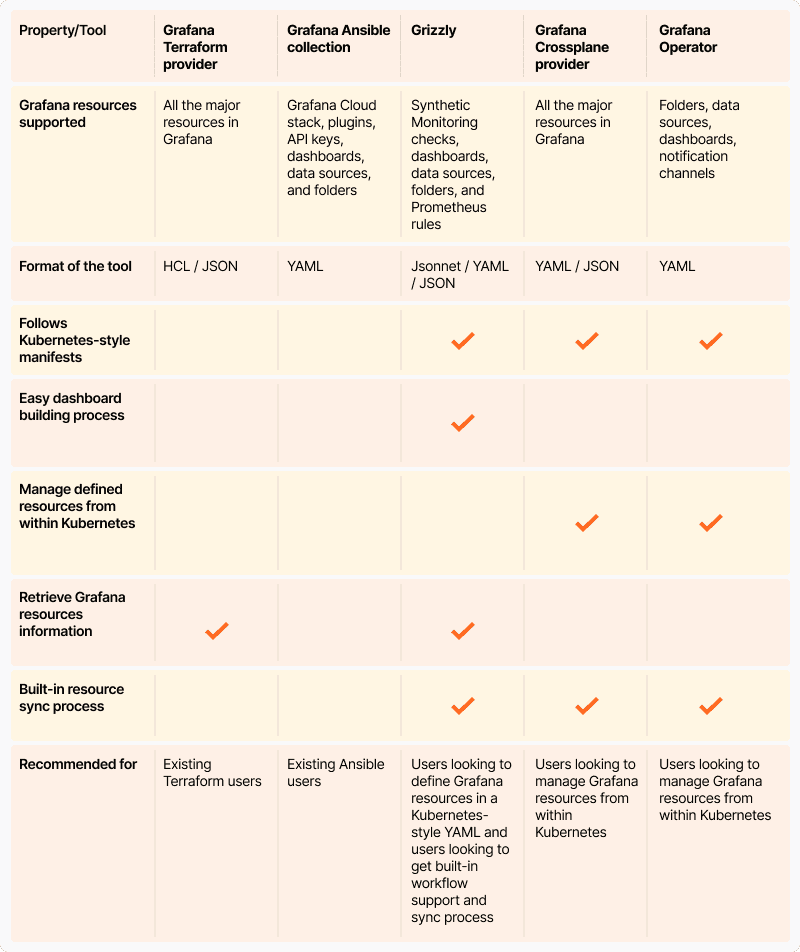
Grafana as code comparison
Here’s a handy comparison chart of all of the properties and tools mentioned above.
For more information or to get started with as code tools for Grafana, check out each individual tool’s repository or contact our team.
Grafana Cloud is the easiest way to get started with metrics, logs, traces, and dashboards. We have a generous free forever tier and plans for every use case. Sign up for free now!

