How Grafana unites Medallia's observability stack for faster, better insights
California-based Medallia captures feedback signals — in-person interactions, customer surveys, call centers, social media, etc. — to help businesses improve their customer experience. In much the same way, the company’s Performance and Observability Engineering team captures observability signals to optimize the experience for internal users.
“For us, to be in this business, it’s crucial that we provide a phenomenal experience to our users through the reliability and performance of our own products,” said Anugrah Vijay, Senior Software Engineer at Medallia.
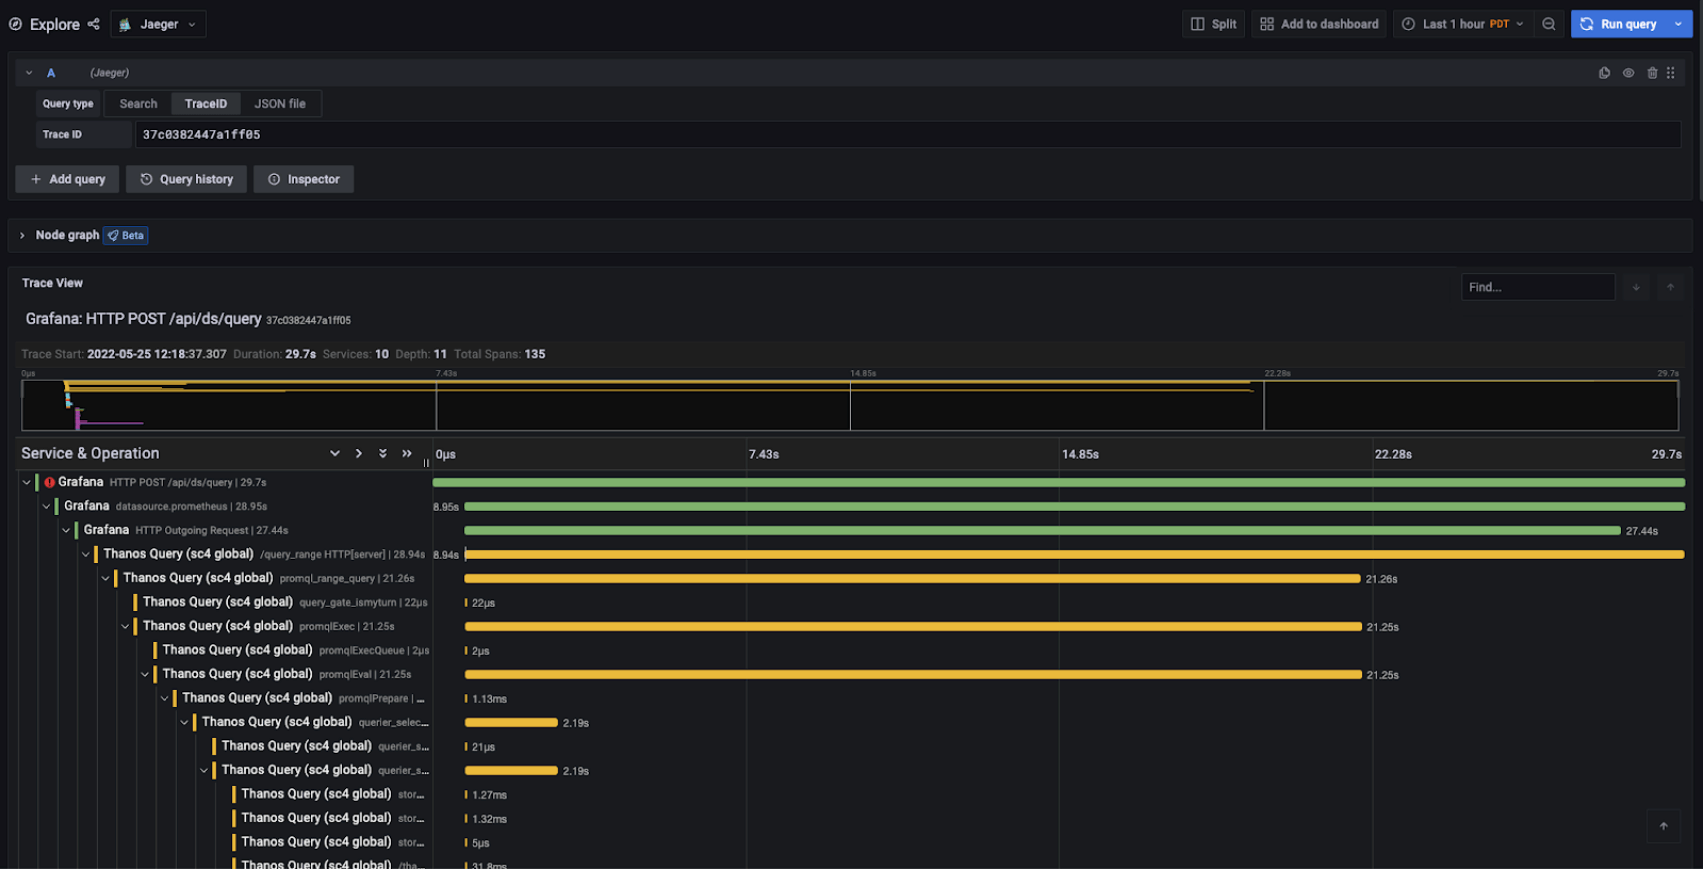
Getting to a place where they could confidently achieve those goals took time. But after many years and iterations, Medallia has found success by making Grafana its unifying tool for observability. Grafana is paired with Prometheus metrics, Grafana Loki logs, and Jaeger traces, which enables them to keep up with the company’s accelerated pace of acquisitions, customer growth, and innovation.
In a recent GrafanaCONline talk, “On Medallia’s journey to centralized observability, Grafana dashboards united it all,” members of Medallia’s Performance and Observability Engineering team shared their experience in making the transition. They discussed lessons learned in the hope it would resonate with other companies looking to start their own journey.

Growing pains drive Medallia to unite observability
About 10 years ago, Medallia hit an inflection point. It had grown significantly — organically and through acquisitions — and its systems had become too divergent, which limited their usefulness and stymied productivity.
“It was pretty clear that being able to observe what was going on in our application, services, and hardware was critical for us to continue to grow and scale,” said Vic Thomas, Principal Software Engineer at Medallia. “Unfortunately, various teams throughout engineering started to build disparate solutions that were for specific pillars of observability.”
The result was a mess of incongruent systems. “We had metrics in Grafana but logging was in a different interface, if at all … and tracing was in yet another interface,” Thomas said. “It was a poor user experience for Medallia employees.”
Their monitoring setup relied on legacy tooling and methodology, and what followed was six years of trial and error as they sought to create a unified vision and ownership for observability.

Grafana as the hub for observability
At first, the team adopted a cloud metrics platform. This was a critical first step to understanding how they had to evolve and gain competence in this new type of tooling, but it came with a catch: Costs scale with the amount of data sent, and as Medallia grew exponentially, so did their bills.
The company wanted to reduce external costs and facilitate use cases not supported by cloud providers, so they cut ties with their metrics vendor and built an internal platform that would lend itself to a smooth transition. “We needed to do this without destroying the system our entire organization had become dependent on,” Vijay said.
They opted for the TICK stack (Telegraf, InfluxDB, Chronograf, Kapacitor), which was gaining popularity at the time and was already used internally by some teams. InfluxDB followed a push-based approach similar to their previous vendor, while Grafana served as the visualization layer, in part because of its support for multiple data sources.

They later added Thanos, which enabled cost-effective long-term data retention through object storage, without compromising on querying latency. It also supported horizontal sharding of Prometheus to circumvent cardinality bottlenecks, while federated querying meant they could have a single pane of glass for all their metrics.
More tweaks followed, including plans to incorporate Grafana Loki to address issues — latency, log ingestion, log aggregation — caused by their expanding global data centers footprint. Ultimately, they’ve been able to create a system that could easily incorporate new environments so they can adapt as needs evolve.
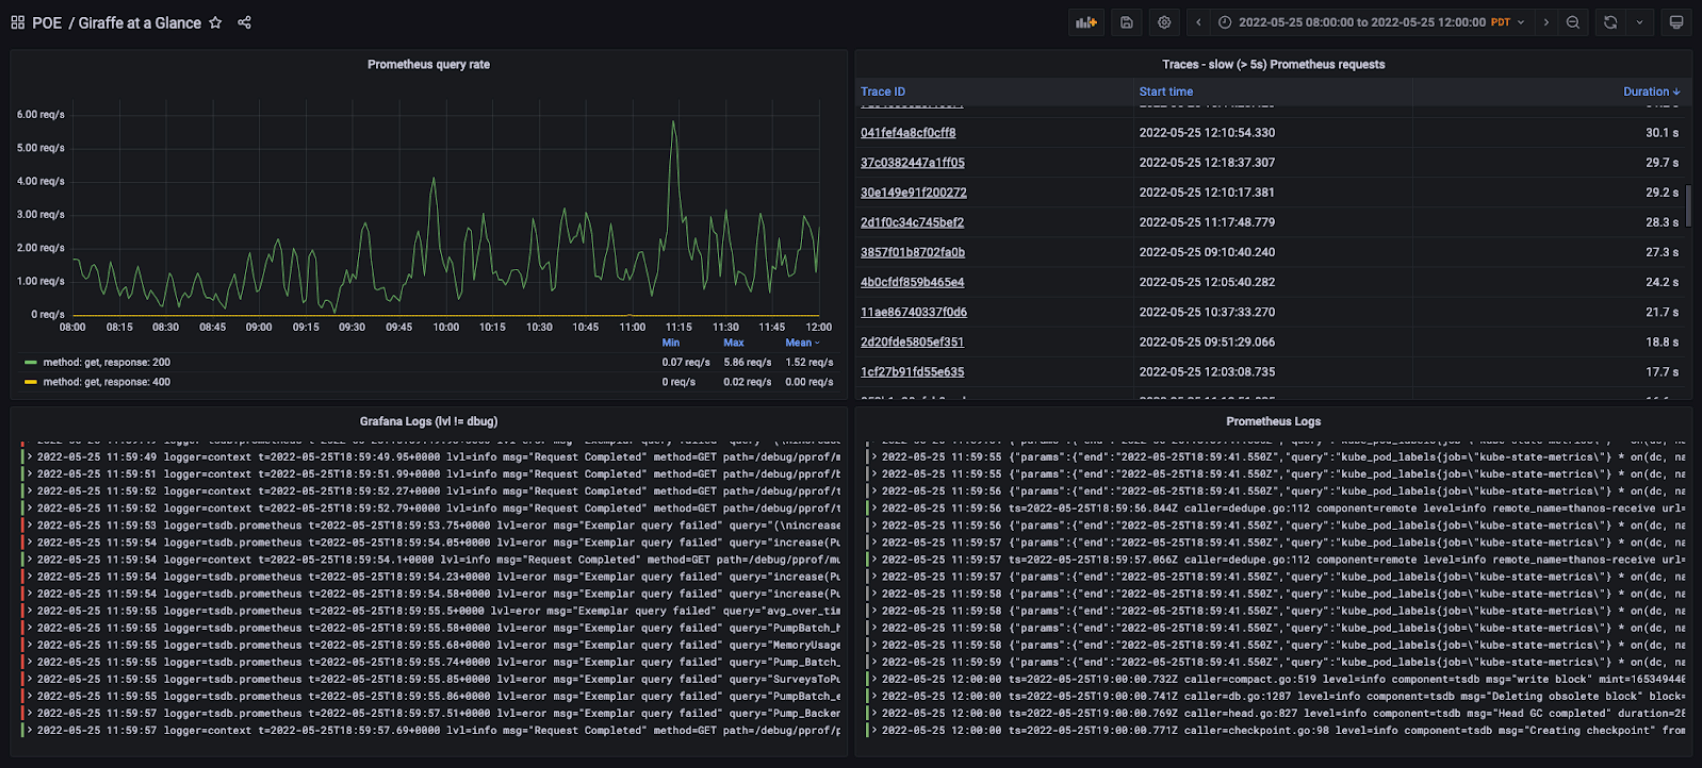
“After six years and many iterations, we’ve arrived at a point where we’ve been able to unify collection, storage, and querying with Prometheus and Thanos,” Vijay said. “That has enabled Grafana to become the single point of access for all our metrics, regardless of environment, source, or purpose.”
There’s still plenty of complexity: 250 million active time series metrics, 21 environments (colocated and in multiple public clouds), a one-year retention policy, more than 300 Prometheus instances, 25,000 alerting and recording rules per minute, and 1.6 billion log lines read per hour. However, most of that complexity is now behind the scenes, which has simplified investigations, helped devs and SRES be more efficient, and driven better business decisions.
With Grafana to unify and visualize their vast amount of data, “we can deliver insights to engineering leadership that we weren’t able to deliver previously,” Thomas said. “That is a powerful thing because it can really impact the quality of the decision making that occurs at high levels in the organization.
Watch the full session to learn more about Medallia’s Grafana journey, and find out why they’re thinking of incorporating other open source tools, including OpenTelemetry, Grafana Mimir, and Grafana Tempo. All our sessions from GrafanaCONline 2022 are now available on demand.
