
How to centralize thousands of data sources with Grafana: Inside Adform’s observability system
Over the course of two decades, Adform grew from a dream between friends huddled in a basement to a leading advertising tech platform powering more than 25,000 clients worldwide. Success brought external accolades, but it also created the need for internal innovation to support the company’s continued growth.
In 2018, Adform was still operating in startup mode, which meant developers and teams cherry-picked the tools that worked best for them. The result was a disjointed system that was inefficient and impossible to maintain. The DevOps team took a deep look at the expanding tech stack and data sources and reached a conclusion: They needed to move to a centralized system.
“We weren’t even able to keep things up-to-date,” says Adform’s DevOps Tech Lead Linas Daneliukas. “We wanted to build monitoring as a service on the products we believe in.”
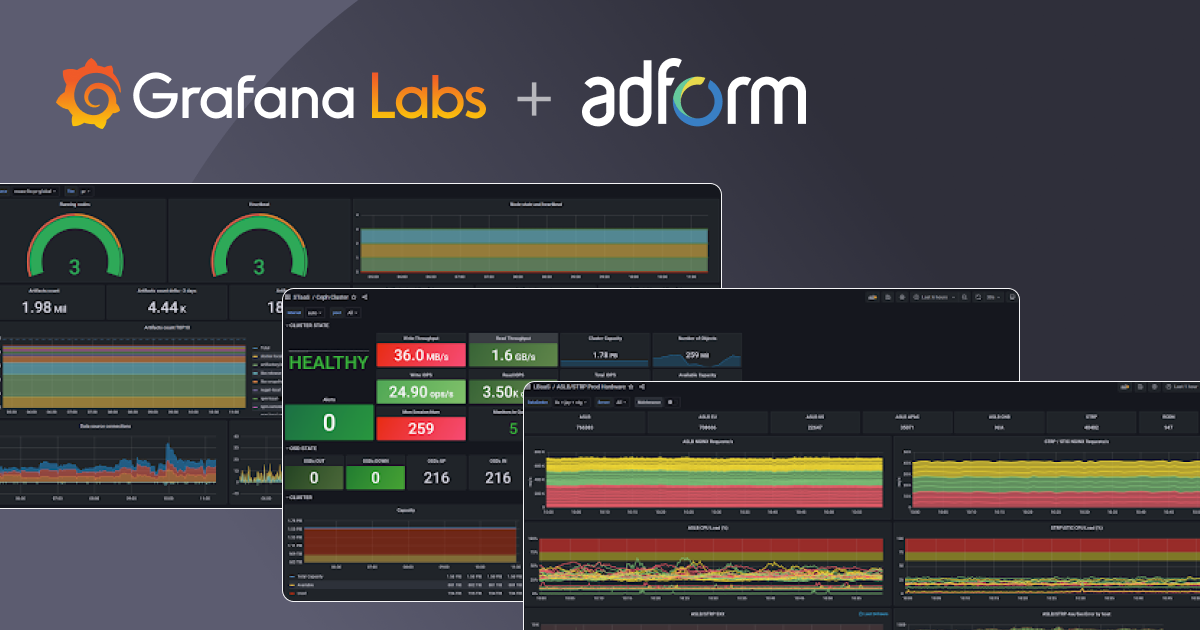
They ultimately decided to build their new centralized system on Grafana and paired it with Prometheus. Today, Adform runs more than 1,400 Grafana dashboards, which connect more than 1,300 data sources and nearly 200 active users across 86 organizations.
Adform’s developers can still choose the tools they prefer, but now the DevOps team has the oversight it needs. “We, as an operator, can have control of the instance itself, but teams have control over their own smaller spaces and can grow as they see fit,” says Daneliukas. “So it was a win-win for us and them.”
The DevOps team has also leaned on Grafana’s online communities as a resource for optimizing their stack, and Grafana’s roadmap of features and functionality has reassured them that they made the right choice. “Everything is simple. We don’t run into roadblocks with Grafana,” says Daneliukus. “It’s constantly being developed. It was the easiest path and the best path.”
Turning chaos into cohesion with Grafana
After the logging and monitoring data was brought together, the DevOps team used Grafana’s organizations functionality to provide each internal teams its own isolated monitoring experience within Adform’s Grafana instance. With this streamlined, cost-effective approach, users can now view all of the other organizations’ data while maintaining admin access over their own.
“It was a good way to separate our teams, but still allow them that visibility so they can find each other’s dashboards and visualizations,” Daneliukas said.

With Grafana’s built-in support for Prometheus Alertmanager, Adform’s central monitoring system gives anyone across the company the ability to see and access any alert. This transparency means greater communication and cross-collaboration across Adform’s teams.
“The ease of troubleshooting has increased exponentially,” said Daneliukas, who added that Adform has cut its CPU core usage by 50%.

Preparing for the next phase of growth
Adform recently ran a successful POC of Grafana Loki during a company-wide hackathon where the DevOps team collected all the logs across more than 3,000 virtual machines with Loki. Full implementation is now on their roadmap. Up next is experimenting with Grafana Mimir as they deepen their unified observability capabilities.
“Our developers want that too,” Daneliukas says. “We never decided to build everything on top of Grafana. It just happened naturally. We’re not favoring Grafana, but somehow it ends up on the top of the list time and time again.”
Check out the full success story to learn more about how Adform’s DevOps team built a central observability system. Plus, find out what they’re building next on Grafana.
Grafana Cloud is the easiest way to get started with metrics, logs, traces, and dashboards. We have a generous free forever tier and plans for every use case. Sign up for free now!

