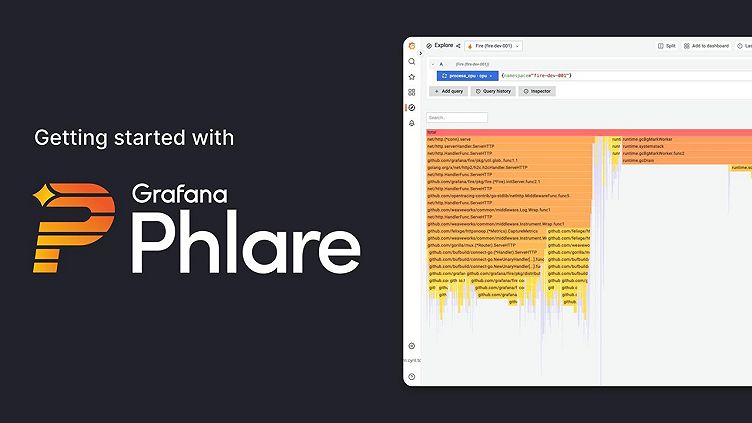
Watch: How to get started with Grafana Phlare for continuous profiling
A big piece of news to come out of ObservabilityCON in early November was the launch of Grafana Phlare. Phlare is an open source, horizontally scalable, highly available, multi-tenant continuous profiling aggregation system. Continuous profiling has been dubbed the fourth pillar of observability, after metrics, logs, and traces.
The idea behind Phlare was sparked during a company-wide hackathon at Grafana Labs. We began looking at continuous profiling to understand the performance of the software we use to power Grafana Cloud, including Grafana Loki, Grafana Mimir, Grafana Tempo, and Grafana. You can use it to help you understand the resource usage of your applications, which can help you optimize performance and cost.
In a new video tutorial, Grafana Labs Principal Engineer Cyril Tovena walks through how to get started using Phlare and highlights some visualization features. (There is also a written tutorial on how to start a single Phlare process.)
There’s supposed to be a video here, but for some reason there isn’t. Either we entered the id wrong (oops!), or Vimeo is down. If it’s the latter, we’d expect they’ll be back up and running soon. In the meantime, check out our blog!
“Phlare is built in the same spirit as Grafana Loki, Grafana Tempo, and Grafana Mimir,” he says, “so if you’re already used to those projects, you’re going to feel right at home.”
How Grafana Phlare works

Cyril starts with an explanation of Phlare basics. “Phlare will scrape profiles in the pprof format,” he says, “and it uses the same service discovery as Prometheus — which means if you’re configuring Phlare with the same configuration that you use for Mimir, or Prometheus, or Loki, you’ll end up with the same labels attached to your profile and be able to correlate between those different symbols very easily.”
Your profiles will eventually be stored on object storage for long-term retention, and then they can be queried via Grafana. To improve the performance of your application, you’ll first look at where the problem is and what to optimize, then you iterate. “Then you look at the benefits and try again,” he says, “and then you iterate again.”
Getting started
To begin, you must have docker-compose and docker installed. He also suggests cloning the Grafana Phlare GitHub repository and going to the tools/docker-compose directory to find the files needed to reproduce his demo.
Grafana Phlare demo
Cyril then walks through the docker-compose file to show where the demo will start and how it works. He runs two services: Grafana Phlare and Grafana (to visualize the data from Phlare). Once Phlare begins syncing and scraping Phlare and Grafana, he accesses Grafana locally and highlights how the Phlare data source is automatically provisioned.
He explains that in Phlare or in profiling in general, you first have to select a profile type — they are never really mixed. The language for selecting a profile is the same as Prometheus metrics (except there’s no metric name) and the same as Loki when you’re selecting a log stream.
After selecting the job (in the demo, the options are Phlare or Grafana), Cyril runs the query and the Graph panel shows the variation of CPU usage over time. “It’s the sum of all the aggregated profiles over time,” he says. You can use the window to drill down using a Flame graph or a Top table and view them individually or in a split view.
The Flame graph shows aggregation per stack trace. The stack trace is represented by a vertical line that shows “the succession of function calls that led to CPU usage,” he explains. By clicking on one of the lines, the panel moves to another view that makes it possible to see the functions that led to the current function call, as well as the function calls that the current function is doing.
“There’s a notion of ‘self’ and ’total,’ " he explains. “The self is the time spent in that function only, and the total is the self plus all the children.”
In the Top table view, the symbol list can be ordered by self. By sorting in descending order, it’s easy to see the top self function (not the children that it calls). The list also can be ordered by total to show which function is at the origin of all the function calls.
Clicking on the Both view and then choosing a function from the list makes it possible to see where a function is in the Flame Graph.
Cyril wraps up the demo by explaining how to change the histogram in order to see the difference between multiple applications. “If you have a very highly replicated staple set or replica set, you’re going to be able to see if there is one part that is higher than the rest,” he says — and that is a good place to start digging into where a problem is happening in an application.
Learn more about Grafana Phlare
For more information on the different ways to deploy Phlare, see Grafana Phlare deployment modes.
Try out Grafana Phlare, learn how to get started with our Grafana Phlare documentation, and let us know what you think! You can open an issue in the Phlare Github repo or join the conversation on the #phlare channel on the Grafana Labs Community Slack.


