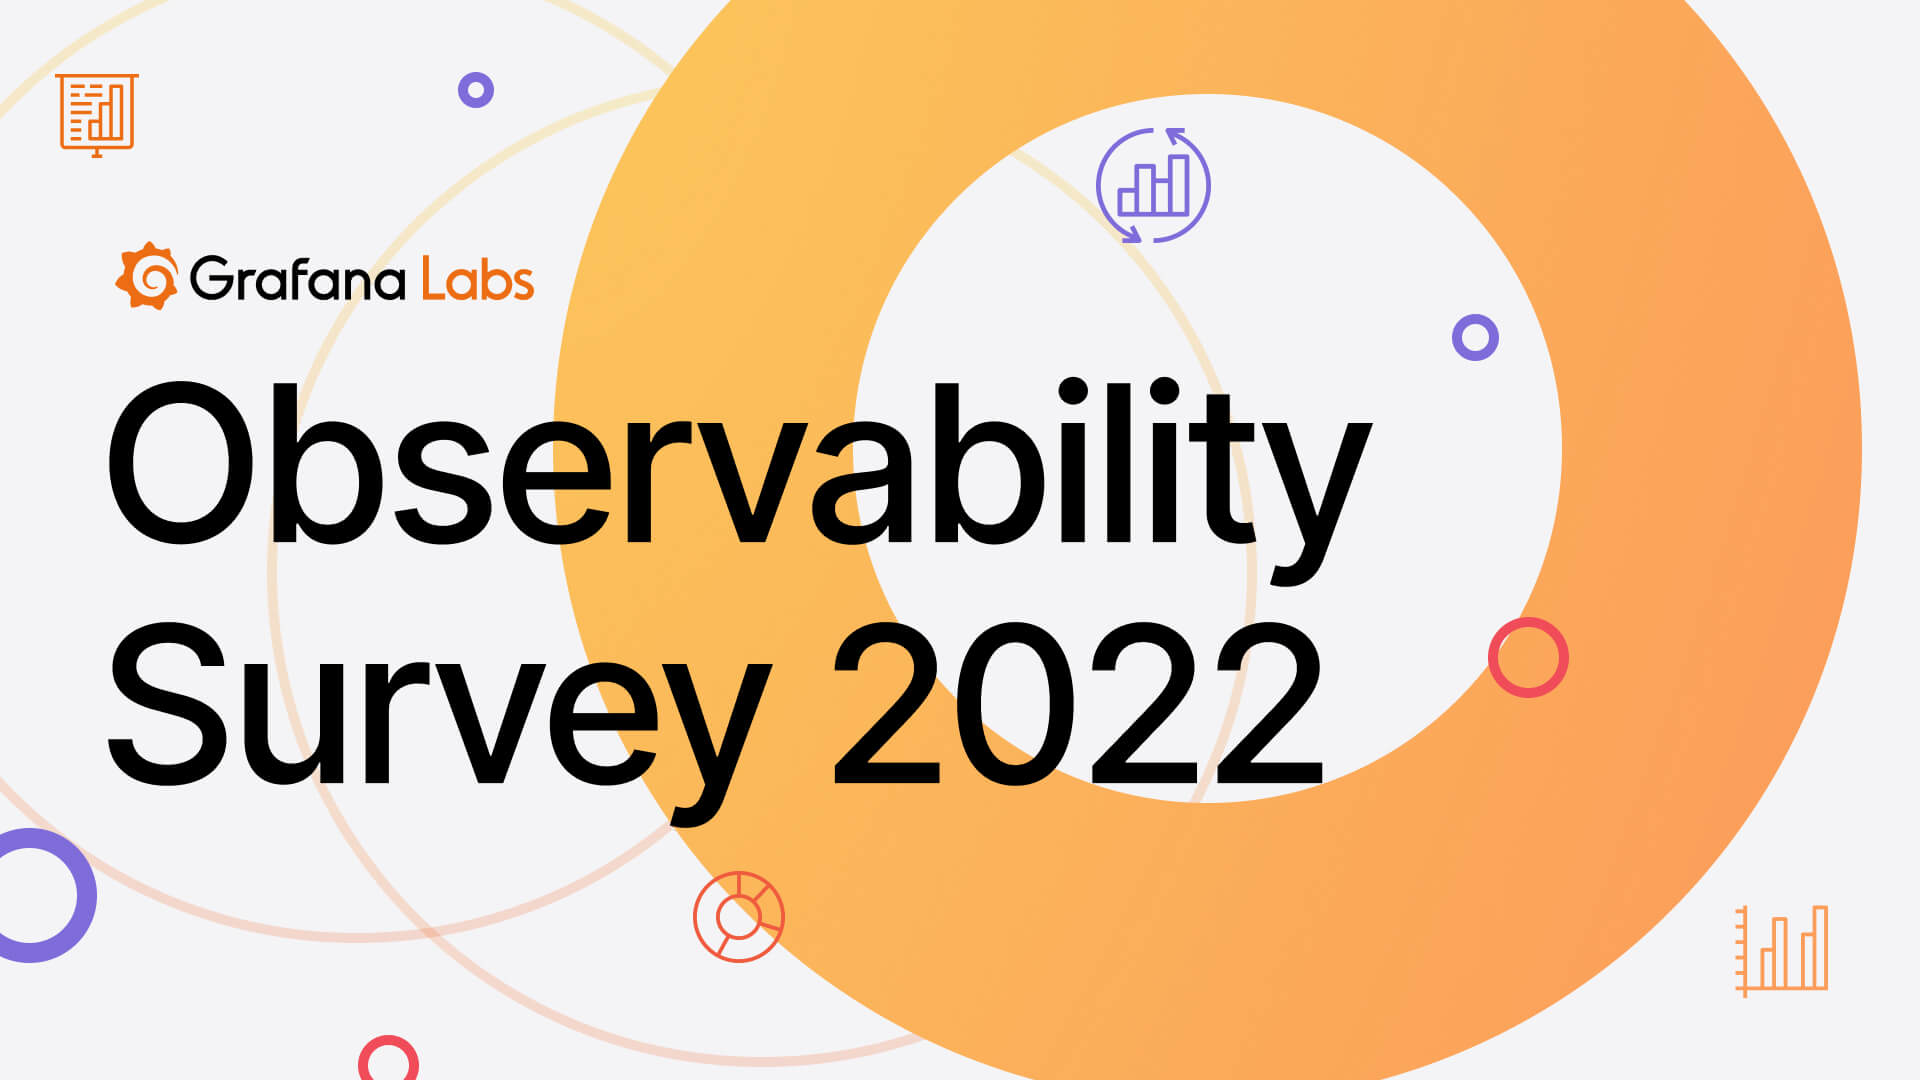
How many data sources do you monitor? Find out how you measure up in our Observability Survey
Here at Grafana Labs, we’re deeply committed to our “big tent” philosophy — the idea that disparate data sources, from different software providers, in different industries, built for completely different use cases, can come together in one composable observability platform. As part of that commitment, we’ve set out to hear from our community about their observability practice and what they hope to see in this space in the future.
We recently launched Grafana Labs Observability Survey 2022 as a way to learn about where community members are on their observability journey, and we’ve had great responses so far. Coming on the heels of ObservabilityCON and all the exciting announcements we made, we want to give you a preview of what we’ve learned thus far from our survey. Here are some of the stats that have jumped out so far:
- Tool overload is real. 67% of teams use four or more data sources configured in Grafana, while 52% of respondents estimated their company uses at least six observability technologies.
- Observability = tangible benefits. Among those who have centralized observability into one tool, 88% said it has saved time or money.
- Companies are setting reliability baselines. 71% are actively using or considering SLOs/SLIs.
Continue reading for a closer look at the initial results of our first-ever Grafana Labs Observability Survey. And it’s not too late to contribute your thoughts: We’d love you to fill out our (super short!) Observability Survey and help us sharpen our understanding of the state of observability within the community. All responses are anonymous and the final results will be revealed in the coming months.
So many data sources, so many tools
Today’s distributed applications rely on complex architectures that often pull from disparate data sources, and our survey is a reflection of that reality. Two-thirds of respondents have four or more data sources configured in Grafana and actively in use, while 30% say they have 10 or more data sources actively connected to Grafana.
That complexity is compounded by the fact that different teams and groups within organizations use a dizzying amount of different tools. When asked how many observability technologies — for metrics, logs, and traces — were used across their entire company, more than half of respondents said six or more. Among that group, there were some stunning outliers: three respondents said their company had between 31 and 75 observability technologies, one said they had more than 76, and two respondents opted for the tongue-in-cheek choice of “can’t count that high.”
Results like that help reinforce our belief that the big tent approach is the future. It’s unrealistic to expect every company to go all-in on a single vendor. Organizations rely on a wide variety of technologies to build, deploy, and manage any number of applications, and it’s our mission at Grafana Labs to support as many data sources and observability tools as possible.
Or, as one respondent put it when asked what they’re most excited about: “Learning! It’s great to learn new tools and technologies. [There’s] lots of neat stuff out there …really too much to know what to focus on. [I] guess that’s a good problem to have though rather than too few tools that aren’t very good.”
And if you’re curious what technologies respondents are using, here are the four that came up most often thus far: Grafana, Prometheus, Grafana Loki, and Elastic/ELK.
Reaping the rewards of centralized observability
With so many tools to juggle, it’s no wonder centralized observability has been a major theme for respondents. Two-thirds said their organization uses a centralized approach to observability, with 88% of those saying it saved time or money. When asked for more specifics about the results of those efforts, the most common responses were related to improved diagnostics and faster mean time to restore (MTTR). Other benefits cited include better ease of use and increased adoption.
As one respondent put it: “Better observability gives great confidence to the teams to learn and experiment.”
And more engineers and developers are expected to follow suit. When respondents were asked what they’re most excited about, the most common answer was centralized observability. Respondents also cited OpenTelemetry, data correlation, Grafana Loki, and distributed tracing.
SLOs/SLIs were another topic of interest, with one respondent adding they’re excited about “getting to the point we start taking SLO/SLI seriously and have a full observability layer.” In addition to those already using SLOs/SLIs, 42% are talking about them or building POCs.
Observability strategies that work
If you want to learn more about the latest and greatest in observability, you can check out all the sessions from ObservabilityCON. In addition to launching new open source projects for continuous profiling and frontend application observability, the annual observability conference brought together Grafana Labs leaders and experts in the field to share their tips and best practices.
ObservabilityCon sessions are now available on demand, including those featuring experts from Adobe, Clearco, Banco Itaú, JPMorgan Chase, Just Eat, and Wells Fargo. It’s your chance to see the latest updates to the Grafana LGTM (Loki, Grafana, Tempo, Mimir) stack and find out what leaders in the field are doing to implement observability at scale.
There’s still time to share your opinions on observability! Check out Grafana Labs’ Observability Survey 2022 today. It’ll only take you four minutes to complete, and you’ll be helping the community get a better understanding of the state of observability.