
How to monitor the health and resource usage of Kubernetes nodes in Grafana Cloud
The spine is essential to perform every activity, like crawling, walking, or swimming. Just as the spine is necessary to enable these functions, your Kubernetes infrastructure needs a backbone to be efficient and effective. So if Kubernetes clusters act as the spine of your architecture, then Kubernetes nodes are like the vertebrae — they make up a Kubernetes cluster in the same way the vertebrae form the spinal column.
Whether on virtual or bare-metal machines, there are two types of nodes in a Kubernetes cluster:
- Worker nodes: These host your application containers, grouped as pods.
- Control plane nodes: These run the services that are required to control the Kubernetes cluster.
If you want your clusters to stay up and your applications to run fast, you need to have a healthy backbone of efficient nodes. You can achieve this in one of two ways:
- Via an expensive autoscaler that buys you more and more cloud resources and spans more and more nodes. While you have seemingly endless resources, it’s hard to pinpoint where the actual issues are.
- By taking a data-driven approach for better capacity utilization, resource management, pod placement, and issue resolution through an opinionated observability tool.
Assuming that an autoscaler alone will not satisfactorily solve your infrastructure problems, I’m happy to share our new Kubernetes node observability feature that is now part of Kubernetes Monitoring, the full Kubernetes solution available to all Grafana Cloud users, including those on the generous free tier. (If you don’t already have a Grafana Cloud account, you can sign up for a free account today!)
How Kubernetes node observability works in Grafana Cloud
There’s a lot of complexity and difficulty when it comes to setting up and scaling Kubernetes monitoring. With node observability in the Kubernetes Monitoring solution in Grafana Cloud, we provide features that address three major problem areas in managing nodes.
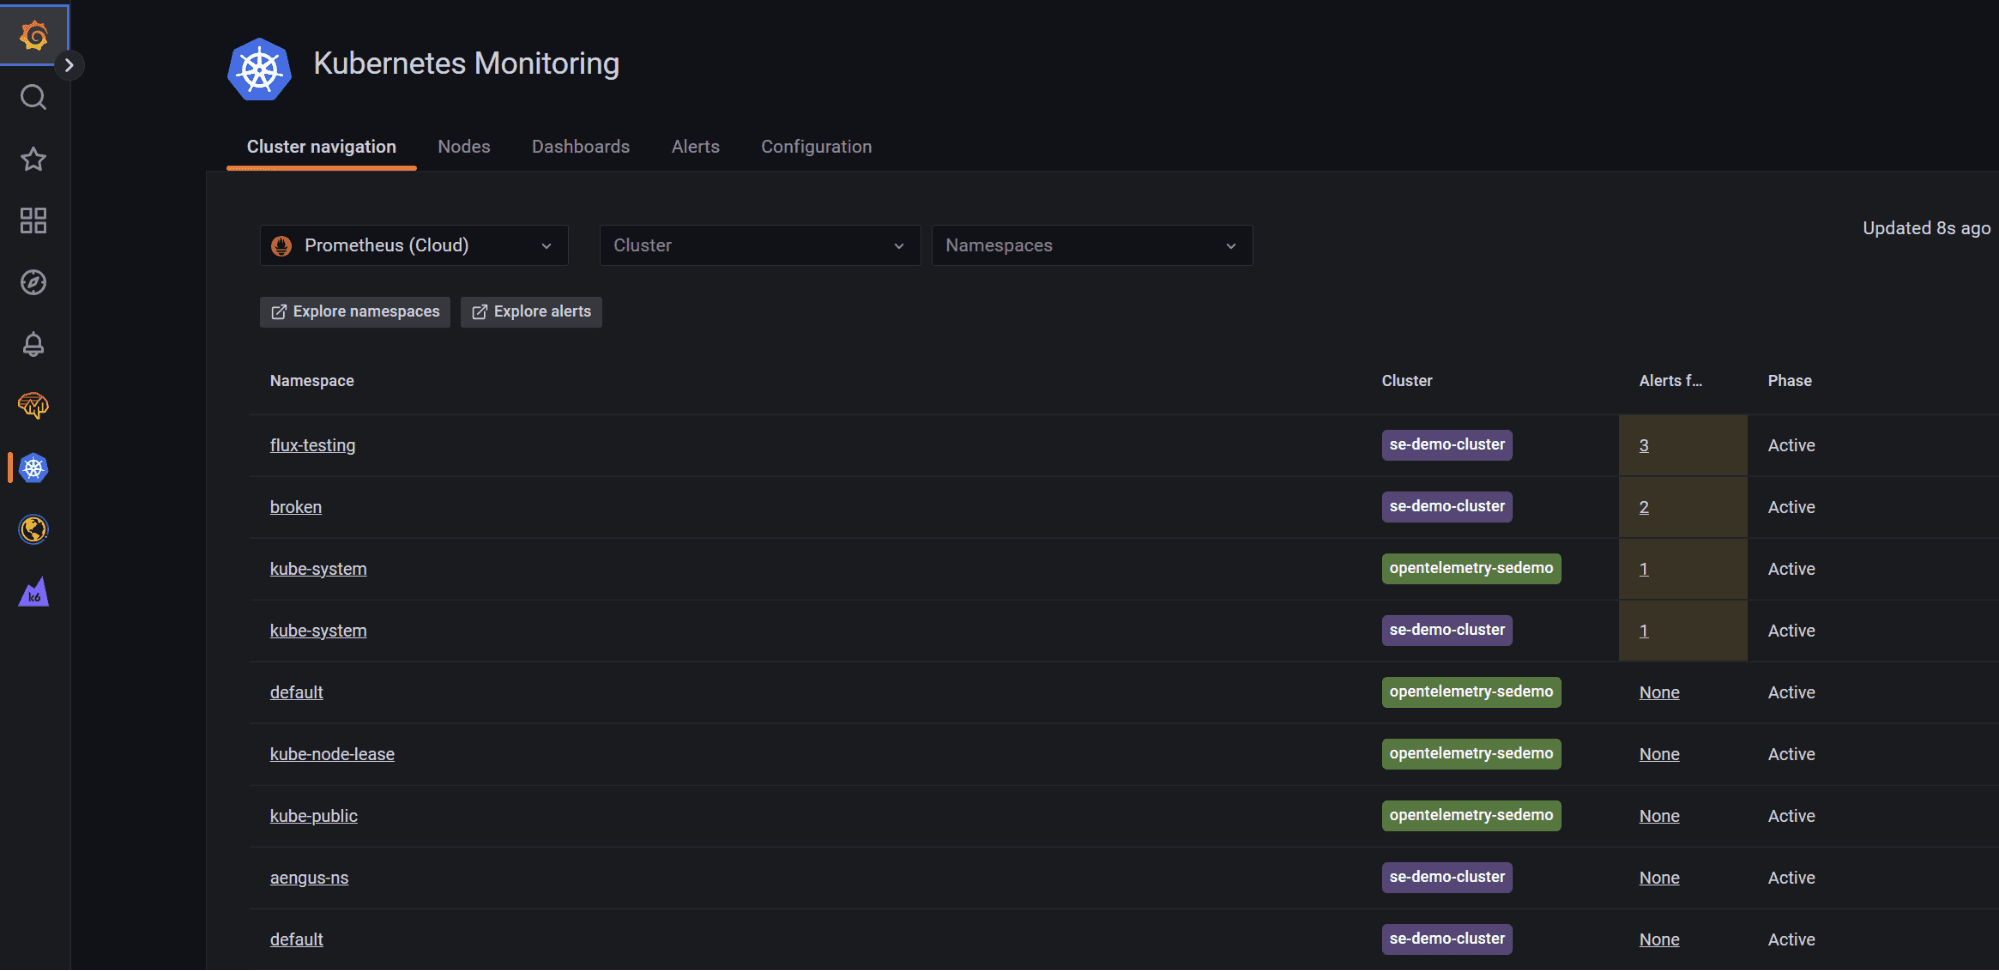
1. Display all nodes in your clusters, as well as their condition and current available resource usage
How this makes your life easier: Decreases the mean time to resolve (MTTR) by providing “one-click” guidance towards an existing or potential issue at a glance.

Insights you’ll gain:
- A bird’s eye view of all your nodes that belong to a cluster with simple cluster filtering.
- Color-coded indicators for CPU and memory consumption.
- The condition of your nodes along with the Kubernetes description.

2. Node capacity, utilization, and resource management indicators
How this makes your life easier: Establishes a North Star to help identify misconfigurations, such as faulty replica sets, and helps spot opportunities to streamline your setup by:
- Mapping pods to nodes based on resource use.
- Optimizing the number of nodes in a cluster.
- Ensuring high availability at the master-node level.
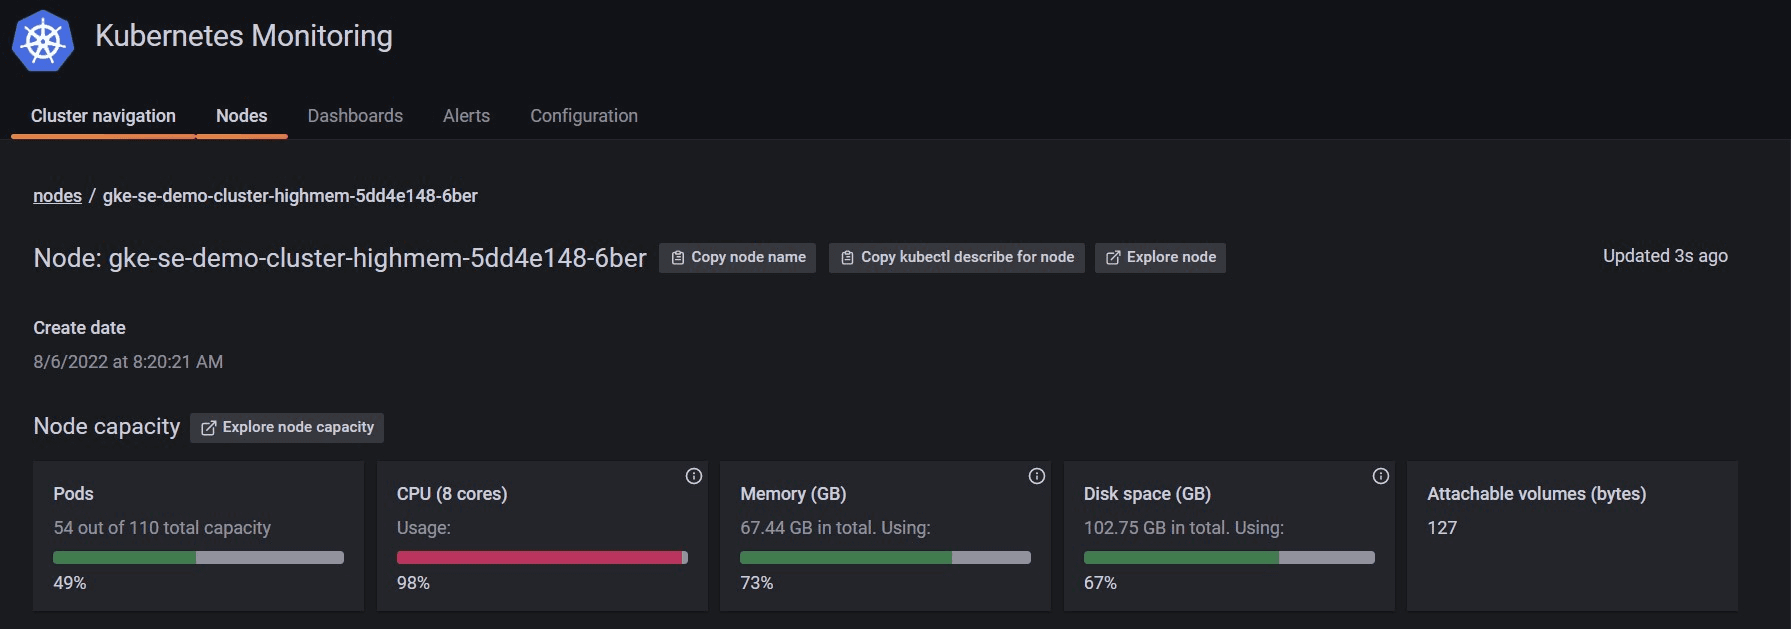
Insights you’ll gain:
- Used vs. available pods in the node
- An instant indication of over-provisioned or under-provisioned nodes in terms of CPU, RAM, storage, and pod density with a new color-coding feature:
- Green indicates usage between 40 and 75%: This is a healthy state for node resources. Resources (CPU, RAM or storage) are at a threshold where they are not considered under-utilized nor are they in a danger zone of exceeding your available resources and evicting pods or not being able to place them and leave them pending.
- Yellow indicates usage is below 40% or between 75 and 90%: Usage below 40% (of either resource) indicates that the node might be over-provisioned; therefore, you are paying for the resource but not consuming it. Usage between 75 and 90% is considered high — not alarmingly unhealthy, but they deserve attention to avoid evicted pods due to unavailable node resources.
- Red indicates usage above 90%: Your node resource is dangerously close to maximum capacity. We recommend immediate attention to any resource that is used above 90% as it can result in longer response time, kubelet to stop answering, and pods to stop being rescheduled.
If the colors are mismatched for different resources, it is a possible indicator that better pod placement can be achieved.
3. Display all pods that belong to a node with their health indicators, status, and logs
How this makes your life easier: Quickly determine the health of each pod in your node. When clicking on a node and scrolling past the general information, you’ll be redirected to a list of all pods within the selected node.
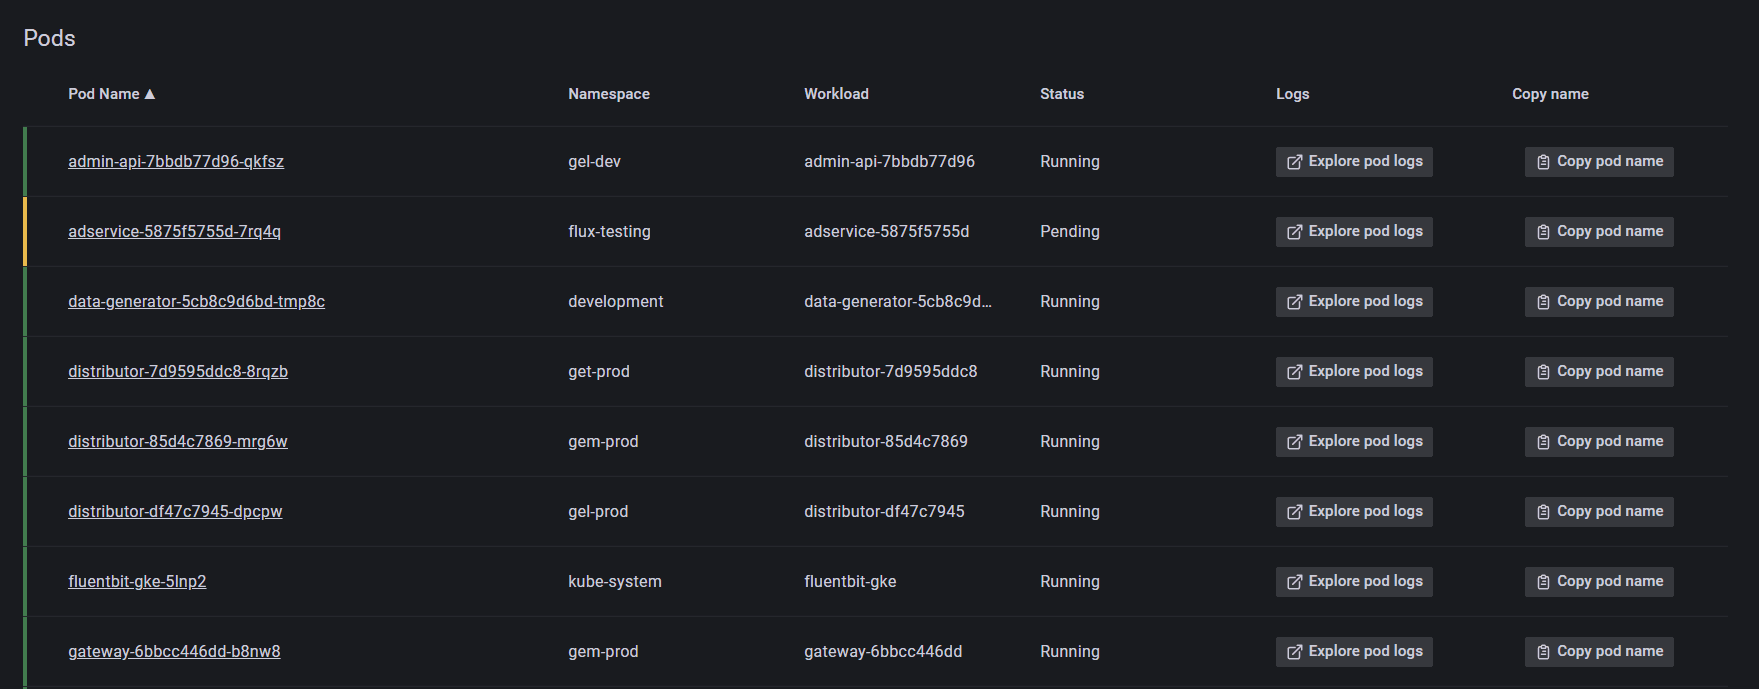
You can see the health of each pod according to the color of the vertical boundary to the left of the pod name.
- Green: Pod is running.
- Yellow: Pod is pending.
- Red: Pod is not running.

Insights you’ll gain:
- A single pane of glass for all pods that belong to the node with indicators towards their health and status.
- Explore unhealthy pod logs with the single-click log drilldown.

Learn more about node observability in Grafana Cloud
For Kubernetes infra-admins, the new node observability feature for Grafana Cloud’s Kubernetes Monitoring solution provides a simple yet powerful tool that delivers key indicators to pinpoint issues or outline improvements in your Kubernetes fleet.
While maintaining the performance and health of your infrastructure is critical, resource utilization is just as important. Downtime from incidents can lead to massive costs, and lack of efficiency in resource consumption can easily do the same.
But with node observability, cluster navigation, and all the features in Grafana Cloud’s Kubernetes Monitoring solution, you can stand tall knowing that you have a full solution for all levels of Kubernetes usage within your organization.
If you want to know how Kubernetes Monitoring in Grafana Cloud can help your organization, go to our Kubernetes Monitoring solutions page, read our related Kubernetes Monitoring documentation or watch our webinar “Kubernetes monitoring out-of-the-box with Grafana Cloud” on demand. You can also refer to the Kubernetes documentation or our Intro to Kubernetes monitoring guide to learn more about best practices for Kubernetes monitoring.

