
How to manage high cardinality metrics in Prometheus and Kubernetes
Over the last few months, a common and recurring theme in our conversations with users has been about managing observability costs, which is increasing at a rate faster than the footprint of the applications and infrastructure being monitored. As enterprises lean into cloud native architectures and the popularity of Prometheus continues to grow, it is not surprising that metrics cardinality (a cartesian combination of metrics and labels) also grows. However, the rate of growth has caught some enterprises by surprise and has become top of mind when it comes to building and maintaining observability systems and practices.
If this sounds familiar and you are currently exploring how to control metrics growth, watch our webinar “How to control metrics growth in Prometheus and Kubernetes with Grafana Cloud” to learn actionable tips and tricks that you can begin implementing today.
But why are metrics growing at such an unprecedented rate?
Cloud native environments and microservices-based architectures combined with developer autonomy and flexibility create a perfect trifecta for an exponential increase in time series data. In cloud native infrastructures, such as Kubernetes, with increasing levels of abstraction comes more time series. What was once a single bare metal server running one application has now been replaced by many pods running many different microservices scattered across many different nodes. Each of these abstracted layers needs a label so they can be uniquely identified, and each of these components generates its own metrics creating their unique set of time series.
In addition, the ephemeral nature of workloads in Kubernetes ends up creating more time series as well. Consider the kube_pod_status_phase metric (one of the kube-state-metrics), which generates a new time series each time a pod changes state, say from “pending” to “running” to “failed” or “succeeded.” Depending on the rate of cluster events, especially with a lot of short running jobs, tracking a single pod’s status alone could generate a lot of metrics.
The ease of instrumentation and autonomy created through a microservices architecture sometimes can result in an increase in cardinality as well. With a rich set of open source exporters out there, as well as client libraries for 15+ programming languages, it’s never been easier to instrument your application to expose Prometheus metrics. With each team empowered to add metrics to their application, governance becomes more challenging. Sometimes metrics relevant in a dev environment might trickle into a production environment and cause a spike in time series. With so many teams instrumenting their applications, it becomes challenging for a centralized observability team to spot and prevent these leaks.
Is it only cloud native monitoring that results in an increase in metrics cardinality?
While high cardinality is definitely more common in cloud native environments, it is also common when non-Prometheus legacy infrastructure (hardware or software) is migrated to a Prometheus-compatible format with exporters. These exporters can be extremely noisy in the number of metrics it generates, contributing to high cardinality. For example, the Prometheus Node exporter, which provides hardware and OS-level system metrics, emits roughly 500 Prometheus time series by default. The mySQL exporter publishes roughly 1,000 time series and not all of those are valuable.
No matter the environment, one of the most common mistakes we see is the use of sub-optimal labels in metrics databases. Since cardinality is a cartesian product of two sets (metrics and labels), how labels are defined goes a long way in keeping cardinality under control. If labels that are randomly generated and have no upper limit of unique values are used (for example, if {session_id} generated with every new connection), then the number of time series could spike when traffic to the system increases. The same could be said for {user_id} or {device_id}.
Alright, high cardinality is a symptom of the environment, but why does it matter?
An increase in cardinality means you now need more infrastructure and compute to store and process these time series. This in turn has a direct impact on how much you spend on your observability platform. Recently this has been top of mind for operators and centralized observability teams.
It also impacts the performance of your observability platform itself. As your database grows, so does the number of time series accessed on any given queries, which can radically slow down your system when you query or visualize the data. Dashboards that are slow to load or queries that are slow to return data prolong MTTR when troubleshooting outages.
Note: The advantage of using a cloud native observability platform, like Grafana Cloud, which is powered by the most scalable time series database Grafana Mimir, is that you won’t experience these performance issues as your count of time series increases.
So how can I control metrics growth?
Since the growth of metrics is inevitable and has consequences to your bottom line, it begs the question on how to control and optimize growing metrics and cost. As is the case with monitoring and observability, the answers to questions begin with having the right visibility and insights into the data.
Below are three key steps to controlling metrics cardinality and costs:
1. Get visibility into high cardinality metrics and valuable metrics
The first step towards any optimization is gaining visibility into which metrics and labels are contributing to cardinality and identifying which metrics are valuable. Metrics that are used in dashboards, alerts, and recording rules are obviously necessary; however, others may only be used for ad-hoc queries when troubleshooting or not queried at all.
The diagram below shows metrics divided into four quadrants based on cardinality and value. You will want to begin by identifying the metrics in quadrant 3, which are high cost, but are not being used. For the metrics that fall into quadrant 4, re-evaluating the granularity and label architecture can produce great returns for metrics and labels that provide value, but have high cardinality.

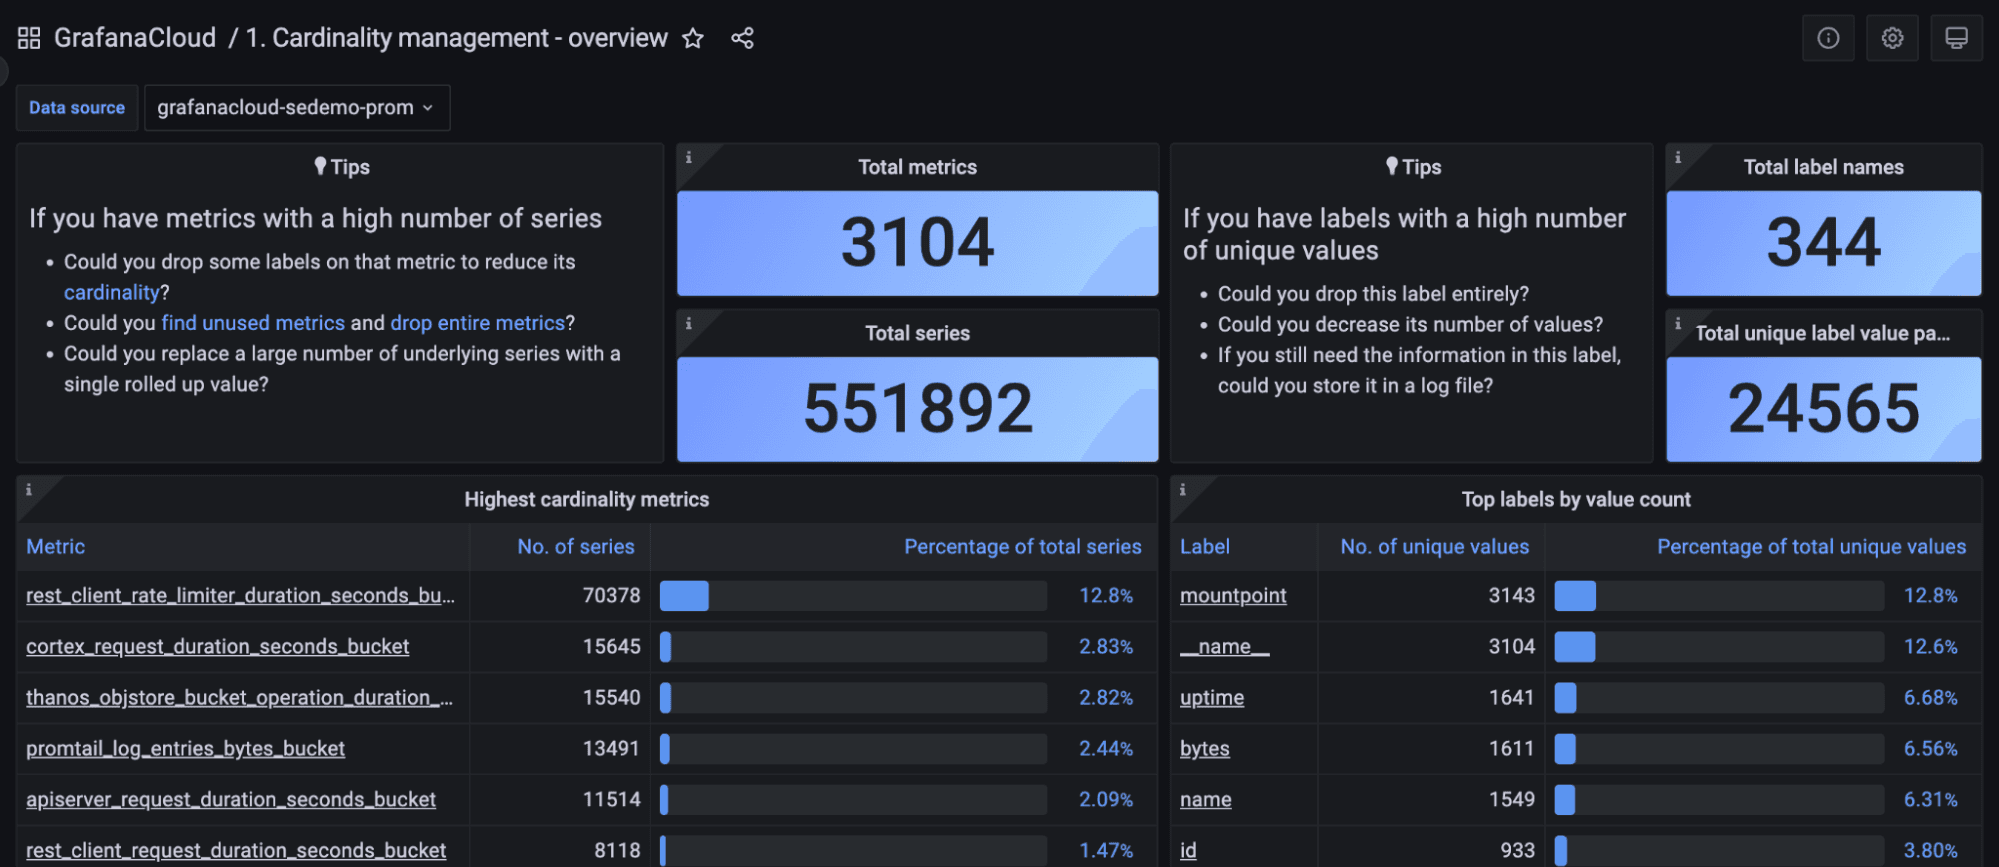
Identifying high cardinality metrics and labels
Grafana Cloud Pro and Advanced plans include a set of cardinality management dashboards to help identify high cardinality metrics and labels and guide your optimization efforts.

To learn more about how to easily monitor cardinality with Grafana dashboards check out:
If you are a Grafana Cloud user and want to learn more about how metrics optimization, contact us.
Discover unused metrics
Mimirtool is an open source tool that can be used to identify metrics in Mimir, Prometheus, or Prometheus compatible databases that are not used in dashboards, alerts, or recording rules. Mimirtool is executed via command line and generates a JSON file with unused metrics.
Metrics that are unused entirely can be safely dropped, if not required for ad-hoc queries or future projects.
Learn more about using Mimirtool to identify unused metrics in these docs:
2. Understand which teams are responsible for metrics growth
Next, you will want to understand which teams and environments are contributing the most to cardinality in your organization.
Grafana Cloud Advanced includes Usage Insights to help identify the sources of cardinality in your environment. Track the number of time series that have a certain label or set of labels applied over time so you can understand how different teams, environments, or applications are contributing to your overall series count. By providing this data as a time series, you can easily pinpoint how a change at a specific point in time led to an increase in your observability bill.

To learn more about using usage groups to monitor metrics allocation, take a look at this blog post:
3. Begin optimizing metrics
In this section, we will cover how to begin optimizing metrics, once you have visibility into metrics and labels resulting in high cardinality and you have been able to identify low and high value metrics.

Inspect data frequency
When forecasting capacity requirements for metrics, it is important to consider your data frequency requirements. The default scrape_interval for Prometheus is 15 sec, or 4 data points per minute (DPM). But if this frequency is not required, the default configuration can result in more data being stored than was forecasted.
To inspect your current scrape_interval, use the query below to find the number of samples scraped over the last minute, split by target:
count_over_time(scrape_samples_scraped[1m])

You can then inspect these metrics and increase the scrape_interval for less critical metrics to reduce costs. Often, less critical metrics can be set to a scrape_interval of 60 sec, which can reduce costs by up to 75%.
To learn more about adjusting scrape_intervals, take a look at our documentation:
Inspect histograms
Histograms allow you to understand the distribution of a particular quantity. The precision of that distribution is determined by the number of buckets you have in that histogram. In Prometheus, each bucket is tracked as a time series that has a specific value of the le (less than or equal to) label.
Using the cardinality management Grafana dashboard in Grafana Cloud, we can see the values for the le label and how this contributes to the overall cardinality. Choose buckets which are most relevant for your environment. For example, if the SLO for a service is a 50 mSec response time, you may not need to distinguish between requests that take 5 mSec and 10 mSec.

You can safely drop the metrics series for buckets that are not needed. This will not result in data loss as the buckets are cumulative. For example, if you drop the “less than or equal to 10” bucket, these values will simply be included in the “less than or equal to 25” bucket. If this level of dimensionality is not required, you can safely drop the 10 value for the le label.
Below is an example of a relabel configuration:
# drop all metric series ending with _bucket and where le="10"
- source_labels: [__name__, le]
  separator: _
  regex: ".+_bucket_10"
  action: "drop"
To learn more about reducing Prometheus metrics usage and relabel configuration, take a look at our documentation:
Reduce labels
For metrics with unused labels, it’s not quite as simple as dropping labels that aren’t used. Dropping a label can result in duplicate series, which will be dropped by Prometheus. See examples below. In the first example, you can safely drop the ip label as the remaining series are unique. However, in the second example, you can see how dropping the ip label will create duplicate time series, which Prometheus will drop. In this example, Prometheus will receive values of 1, 3, and 7 for my_metric_total with the same time stamp and will drop 2 of the data points.
# You can drop ip label, remaining series are still unique
my_metric_total{env=“dev”, ip=“1.1.1.1"} 12
my_metric_total{env=“tst”, ip=“1.1.1.1"} 14
my_metric_total{env=“prd”, ip=“1.1.1.1"} 18

#Remaining values after dropping ip label
my_metric_total{env=“dev”} 12
my_metric_total{env=“tst”} 14
my_metric_total{env=“prd”} 18

# You can not drop ip label, remaining series are not unique
my_metric_total{env=“dev”, ip=“1.1.1.1"} 1
my_metric_total{env=“dev”, ip=“3.3.3.3"} 3
my_metric_total{env=“dev”, ip=“5.5.5.5"} 7

#Remaining values after dropping ip label are not unique
my_metric_total{env=“dev”} 1
my_metric_total{env=“dev”} 3
my_metric_total{env=“dev”} 7
You can safely drop labels, if doing so will not result in duplicate series.
In environments where you have control of the application, you can reconfigure the agents used for metrics collection to drop labels which are unused.
If you do not have control of the application and dropping labels will result in duplicate series, applying a function (i.e. sum, avg, min, max) via Prometheus recording rules can allow you to keep the aggregate data, while dropping individual series. In the example below, we use the sum function to store the aggregate metric, allowing us to drop the individual time series.
# sum by env
my_metric_total{env="dev", ip="1.1.1.1"} 1
my_metric_total{env="dev", ip="3.3.3.3"} 3
my_metric_total{env="dev", ip="5.5.5.5"} 7

# Recording rule
sum by(env) (my_metric_total{})

my_metric_total{env="dev"} 11
You can learn more about reducing Prometheus recording rules and relabel configuration in the following resources:
Learn more about managing metrics in Prometheus and Kubernetes with Grafana Cloud
To get started understanding cardinality in your environment, attributing costs to teams and environments, and optimizing your metrics costs, sign up for Grafana Cloud. This includes a 14-day trial of Grafana Cloud Pro, so you’ll be able to try the cardinality management dashboards, usage groups, and other technologies in your environment.
To learn more about how to control metrics costs in Prometheus and Kubernetes environments, you can also check out our webinar “How to control metrics growth in Prometheus and Kubernetes with Grafana Cloud” on demand.
If you are a Grafana Cloud user and want to learn more about how we can help you in your metrics optimization journey, contact us.

