

Grafana 9.2 release: Troubleshooting Grafana panels with a new support feature
Ever run into issues building a panel in your Grafana dashboards? To help with those issues, the current support process for Grafana, Grafana Cloud, and Grafana Enterprise often requires many cycles where we request more information. This can be slow, frustrating for both our users and our support teams, and the process makes it difficult to reproduce issues without access to similar data.
In the Grafana 9.2 release, we introduced a new panel help feature designed to help dashboard editors better communicate issues with our support teams. Now when you encounter problems with any of your visualizations, you can send the panel’s JSON model to Grafana Labs technical support and request help with your issue. The panel that you send includes query response data (with sensitive data randomized!) and all visualizations settings. This will help eliminate some of the friction that comes with troubleshooting panel problems.
There’s supposed to be a video here, but for some reason there isn’t. Either we entered the id wrong (oops!), or Vimeo is down. If it’s the latter, we’d expect they’ll be back up and running soon. In the meantime, check out our blog!
Grafana panels: How to request help in Grafana 9.2
When you navigate to Panel menu > More, there is a new menu item that says Get help. This opens up a wizard that will create snapshots of data that can be sent to our support teams, either as a GitHub issue or within the Grafana help system (support tickets can be sent via the Grafana portal or to support@grafana.com), to better help communicate any panel issues.
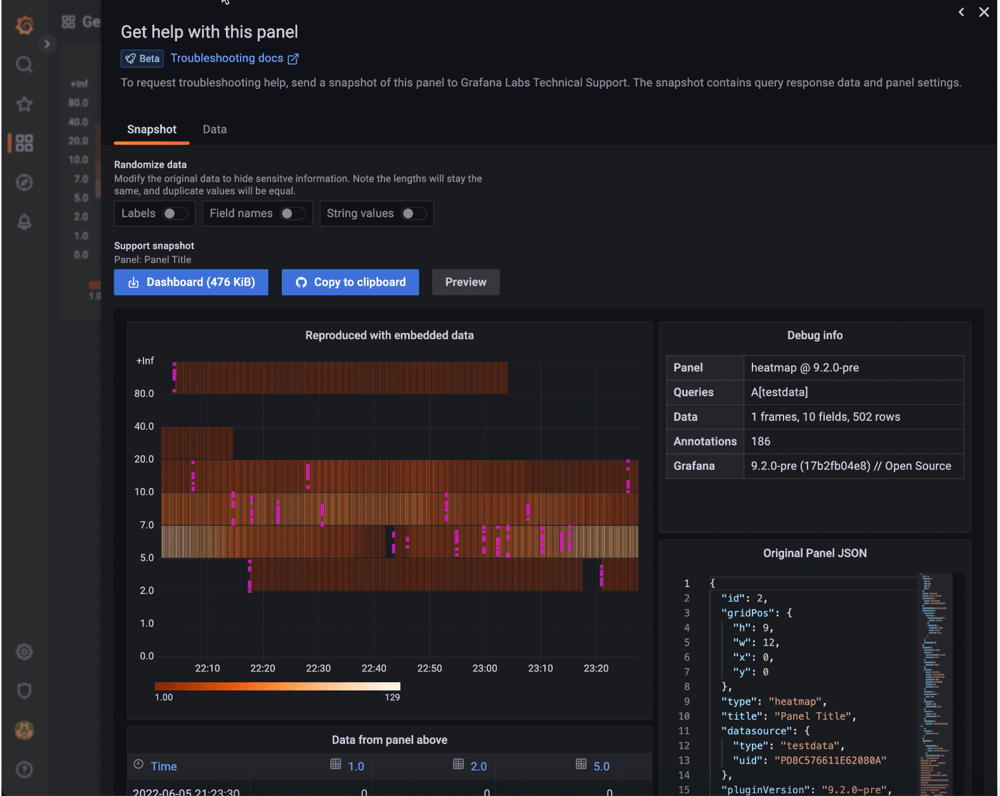
The wizard creates a standalone Grafana dashboard that has all the original data, some overview info, but most importantly, what the structure looks like and what the configuration was at the time of the issue. You can also download snapshots and include it in the help issue. For panels that are more complicated with complex transformations, these snapshots will also provide the data both before and after transformation.
On the receiving end, the Grafana Labs support teams will see exactly what users are looking at and have a simple way to copy the dashboard and import it into a new instance in order to see what is happening within our development environments. With this new Grafana panel help option, the Grafana Labs support team will be able to reproduce, diagnose, and fix the issue in a more seamless way.
Learn more about Grafana 9.2
For a complete list of new features in Grafana 9.2, check out the Grafana documentation, changelog, or the What’s New in Grafana 9.2 documentation.
Join us on our Grafana Labs community forums to discuss any of the new features, workflows, or how to incorporate these changes into your dashboards, queries, and visualizations.
Or if you’re exploring Grafana for the first time, check out our “Getting started with Grafana” webinar on demand for free!
You can download Grafana 9.2 today — or try Grafana 9.2 on Grafana Cloud, which has a generous free forever tier and plans for every use case. Sign up for free today! You can also refer to our Upgrade Grafana documentation for more information about upgrading your Grafana installation.