
Grafana 9.2 release: New Grafana panel help options, Grafana oauth updates, simplified variable editor for Grafana Loki, and more!
Welcome to Grafana 9.2, a jam-packed minor release with a wide range of improvements to help you create and share Grafana dashboards and alerts.
Along with new developments for public dashboards and support for Google Analytics 4 properties, Grafana 9.2 offers new ways to connect with support teams about panel issues, a simplified query variable editor for Grafana Loki, improvements to access control, and much more.
There are also security fixes included in Grafana 9.2. You can learn more in this Grafana security blog post.
If you’d like to dig into all the details, check out the complete changelog or the What’s New in Grafana 9.2 documentation.
Grafana visualizations
New panel help option
Available in Grafana OSS, Grafana Cloud (Free, Pro, and Advanced), and Grafana Enterprise
Ever run into issues building a panel in your Grafana dashboards? To help with those issues, the current support process for Grafana, Grafana Cloud, and Grafana Enterprise often requires many cycles where we request more information. This can be slow, frustrating for both our users and our support teams, and the process makes it difficult to reproduce issues without access to similar data.
With Grafana 9.2, when you navigate to Panel menu > More, there is a new menu item that says Get help. This opens up a wizard that will create snapshots of data that can be sent to our support teams, either as a GitHub issue or within the Grafana help system, to better help communicate any panel issues.
The wizard creates a Grafana dashboard that has all the original data, some overview info, but importantly, what the structure looks like and what the configuration was at the time of the issue. With the new panel help option, the Grafana Labs support team will be able to reproduce, diagnose, and fix the issue as quickly as possible.

To learn more, see our Grafana panel support documentation for more info.
Add custom elements with the Canvas panel
Available in beta in Grafana OSS
Introducing the Canvas panel, a new panel that combines the power of Grafana with the flexibility of custom elements.
Canvas visualizations are extensible form-built panels that allow you to explicitly place elements within static and dynamic layouts. As a result, you can design custom visualizations and overlay data in ways that aren’t possible with standard Grafana panels, all within Grafana’s UI. If you’ve used popular UI and web design tools, then designing Canvas panels will feel very familiar.
For example, you can place image layers and then overlay text that’s updated by Grafana data sources. You can then display icons that can change color conditionally based on data.
We’ve planned additional features and design elements for future releases to make Canvas panels even more powerful tools for creating custom, interactive, data-driven visualizations. To learn more about the Canvas panel, see the documentation.
Simplified query variable editor for Grafana Loki
Generally available in Grafana OSS
For Grafana Loki users who use template variables in Grafana dashboards, we wanted to make it easier to create variables without having to know the exact syntax to get label names or label values. So to complement the Grafana Loki query builder we introduced in Grafana 9.0, we are rolling out updates to the query variable editor for Grafana Loki that introduce dropdowns to make creating and editing variables easier.

Not only is this feature backwards compatible with any variable you may have already created. It will also make creating and editing variables for your Grafana dashboards more seamless in the future.
For more information, refer to our Grafana Loki data source documentation.
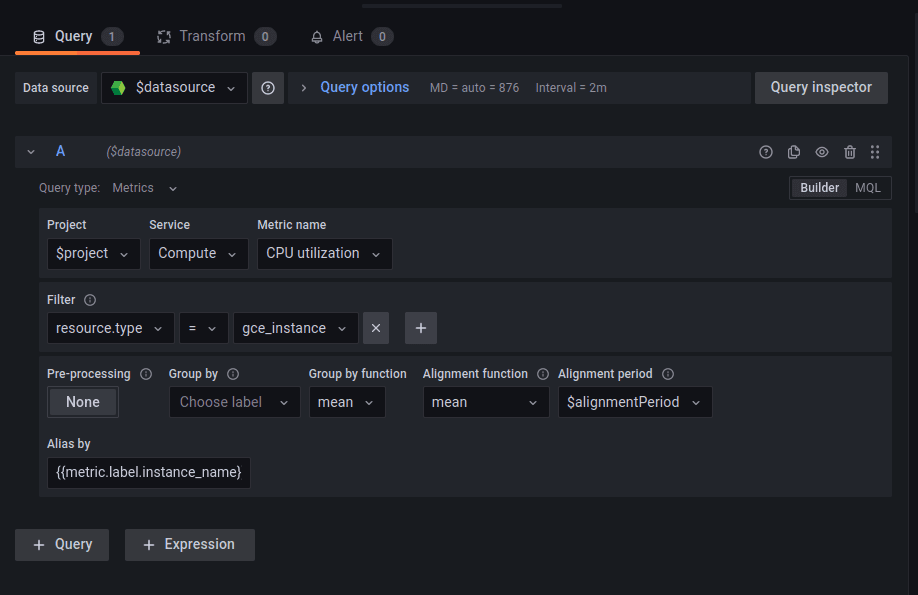
Improved UI for Google Cloud Monitoring
Generally available in Grafana OSS and Grafana Cloud (Free, Pro, and Advanced)
For users who leverage the Google Cloud Monitoring plugin, we have updated the experience with a new interface that groups query builder items together more logically, so it’s more intuitive to build queries. In the case of Google Cloud Monitoring, this also means the query builder groupings should more closely align with the groupings in the Google Cloud console.
Overall, the Google Cloud Monitoring data source UI has been updated to reflect the latest Grafana UI design, so it provides a more consistent experience as you switch between different data sources.
To learn more, check out our webinar “Observability with Grafana and Google Cloud platform” on demand.
Transformations: INNER JOINS
Generally available in Grafana OSS, Grafana Cloud (Free, Pro, Advanced), and Grafana Enterprise
Transformations allow you to shape raw query data from data sources, like metrics series or GitHub issues, so that you can visualize them as clearly as possible. We have extended the JOIN transformation to support both INNER JOINS and OUTER JOINS, which work similarly to SQL JOINs.
Two things to note when using inner JOIN clauses:
- Make sure that the field is selected in all the tables you are querying
- Be aware there you will likely produce fewer results in an INNER JOIN compared to an OUTER JOIN.

To learn more, go to our Grafana transformations documentation
Grafana Alerting: Alert rules return an error state by default on execution error or timeout
Generally available in Grafana OSS, Grafana Cloud (Free, Pro, and Advanced), and Grafana Enterprise
Error rules created with Grafana Alerting were previously switching to an alerting state when the rule was facing an execution error or timeout. New error rules now switch by default to the Error state when failing to execute or timing out. You can change this default to either Alerting or OK.
Note: This change does not update existing alert rules.
For details on this change, see GitHub pull request #55345. For more information about alerting states, see the Grafana Alerting documentation.
Authentication and authorization
What we are always driving for in Grafana authorization is a simple way for administrators and teams to give just the right amount of access. This is how we make it easy for new teams to start using Grafana for observability and for people to spread Grafana throughout their large organizations.
Create and assign roles in Terraform
Generally available in Grafana Enterprise and Grafana Cloud Advanced
We beefed up our Terraform provider, so you can now assign fixed and custom roles to users, teams, and service accounts with the Grafana role_assignment resource in Terraform. This allows you to provision user permissions in a version-able, repeatable way if you use Terraform. In addition to functionality such as defining roles and granting dashboard and data source permissions, Terraform now covers the gamut of permissions that you would need in Grafana, making it a first-class user interface for role-based access control (RBAC).
UI updates
All features below are generally available in Grafana Enterprise and Grafana Cloud Advanced
Role picker when creating and editing teams
We’ve made it possible for you to assign roles to new teams and group custom roles with the addition of a role picker to the UI. This is a small but mighty improvement that makes it easier to create teams and give them permissions more efficiently at the outset.

Organize custom roles into groups
If you create many custom roles in Grafana — for example, different roles for editing specific dashboards or folders, or specific roles for certain teams in your company — you can now organize them into groups for more efficient navigation, browsing, and custom role assignment. For more information on custom roles, see the documentation on creating custom roles.

Grafana SSO upgrades
All features below are generally available in Grafana Enterprise, Grafana Cloud Pro and Grafana Cloud Advanced
Map a user to all organizations in Grafana
You can now use * as the Grafana organization to add all users from a given SAML organization to all existing Grafana organizations. For more information, see the Configure SAML authentication section in the Grafana documentation.
Assign Server Admin permissions from Oauth
You can now map OAuth groups and roles to Server Admin for the GitLab, GitHub, AzureAD, Okta, and Generic OAuth integrations. To enable this functionality, set the allow_assign_grafana_admin configuration option to true in the desired OAuth integration section. For more information, see the authentication configuration documentation for each OAuth client.
Learn more about Grafana 9.2
For a complete list of new features, check out the Grafana documentation, changelog, or the What’s New in Grafana 9.2 documentation.
You can also join us on our Grafana Labs community forums to discuss any of the new features, workflows, or how to incorporate these changes into your dashboards, queries, and visualizations.
Plus check out our “Getting started with Grafana” webinar on demand for free!
Upgrade to Grafana 9.2
Download Grafana 9.2 today or try Grafana 9.2 on Grafana Cloud, which has a generous free forever tier and plans for every use case. Sign up for free today!
Refer to our Upgrade Grafana documentation for more information about upgrading your Grafana installation.
Thanks!
A big thanks to all the Grafana users who contributed by submitting PRs, bug reports, and feedback! Also, the community has helped to add Controls support to all our stories in Storybook. Storybook Controls allow you to dynamically control individual components to see how they work and how you can use them. Check out the Grafana React component library at https://developers.grafana.com/.

