
How to easily configure Grafana Loki and Promtail to receive logs from Heroku
Heroku is a cloud provider well known for its simplicity and its support out of the box for multiple programming languages. When thinking about consuming logs from applications hosted in Heroku, Grafana Loki is a great choice. But in the past, shipping logs from Heroku to any Loki instance required ad-hoc scripts to fiddle with Heroku’s logs format and send them. This can be a time-consuming experience.
That changed with the commit 0e28452f1: Loki’s de-facto client Promtail now includes a new target that can be used to ship logs directly from Heroku Cloud. This blog post will describe how to configure Promtail for receiving logs from Heroku and sending them to any Loki instance.
Heroku logging overview
Heroku allows any user to send logs by using what’s called HTTPs drains. These are applications that understand Heroku logs format and expose an HTTP endpoint for receiving those. Having configured one of these applications, one can just indicate Heroku the URL where the receiving application is listening to and logs will start flowing in there.
Promtail now introduces a target that acts as one of these drains. That means that just by enabling this target on Promtail yaml configuration, and making it publicly exposed, it’s ready for receiving logs.
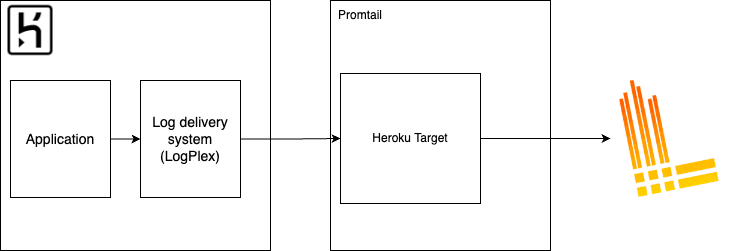
To understand the flow better, everything starts in a Heroku application logging something. Log entries produced by apps in Heroku cloud are sent to the log backbone called LogPlex. LogPlex is basically a router between log sources (producers, like the application mentioned before) and sinks (like our Promtail target). This log line ends up being routed through this delivery system, and translated to an HTTP request Heroku makes to our internet-facing endpoint. Upon receiving this request, Promtail translates it, does some post-processing if required, and ships it to the configured Loki instance.
Set up requirements
Before we start on how to setup this solution, you’ll need:
- Heroku CLI, authenticated
- Git
- A Heroku application; we’ll refer to this as RealApp
- A Grafana instance with a Loki data source already configured
For this tutorial, every time we refer to the RealApp, we will be referring to a running Heroku application whose logs we intend to ship to Loki. Also, we are using Grafana Cloud for the Grafana and Grafana Loki instances. Also, we’ll need administrator privileges in the Grafana Cloud organization to access the Loki instance details and to create an API Key that will be used to send the logs.
For finding the Loki instance details, go to grafana.com, sign in to your organization, and in the left pane pick the stack you want your Heroku application logs to be shipped to. In there, you’ll see some cards under the subtitle Manage your Grafana Cloud Stack. Click the Details button under the Loki card.
You’ll see the following details:

Copy the following, as shown in this example:
- Loki URL Host: logs-prod3.grafana.net
- Loki User: 123456
Then, we’ll need a Grafana API Key for the organization, with permissions sufficient to send metrics. If you already have one, feel free to use it. If not, click the Generate now button displayed above.
A modal like the following will appear:
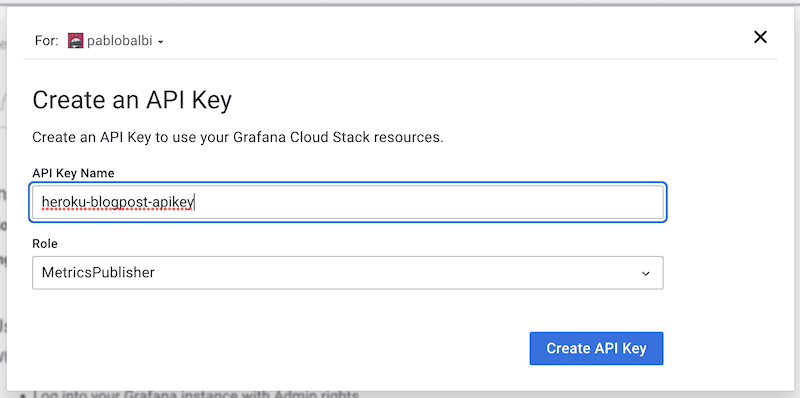
Pick an API Key name of your choice and make sure the Role is MetricsPublisher. Once filled in the details, click Create API Key.
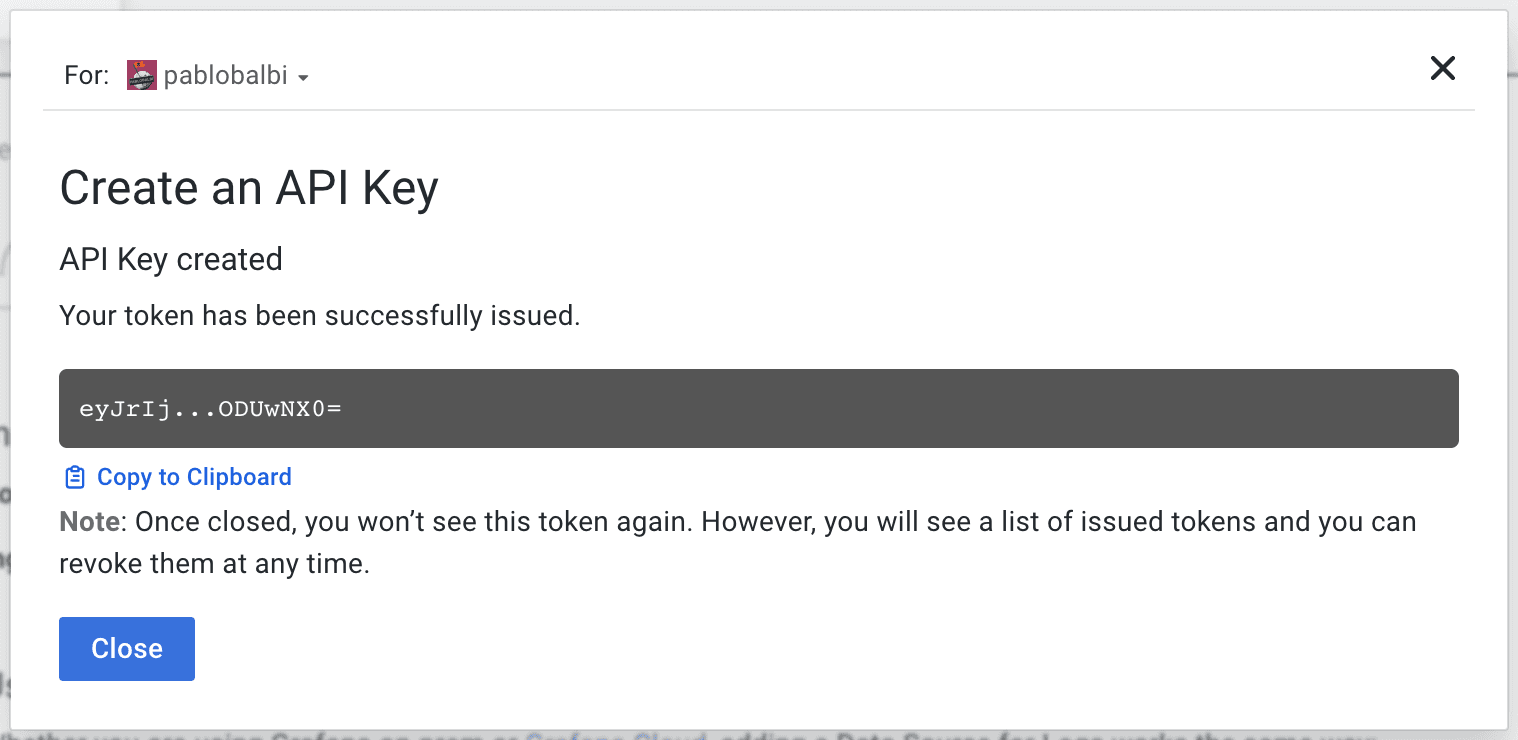
Now copy the newly created API Key; we’ll refer to it as Logs API Key.
How to configure Grafana Loki and Promtail for Heroku logs
Before going into the steps to set up this solution, let’s take a high-level view of what we’ll do:
- Create a new Heroku app for hosting our Promtail instance
- Configure a Heroku drain to redirect logs from RealApp to Grafana Loki
- Test that the logs are being received
Host Promtail in Heroku
Since we are using Heroku to host our application, let’s do the same for our Promtail instance. First, let’s create a new Heroku app and a git repository to host it.
mkdir promtail
cd promtail
git init
heroku apps:create promtail
Then, to simplify all the configurations and environment setup needed to run Promtail, we’ll use Heroku’s container support.
heroku stack:set container
Now that we have our repository and app created, let’s get to the important part — configuring Promtail. For that, we’ll add the following files to the repo, or you can copy them from the Loki examples repository.
heroku.yml
# Heroku application configuration. It indicates heroku what to deploy
build:
  docker:
    web: Dockerfile
config.yml
server:
    http_listen_port: 9080
    grpc_listen_port: 0
    log_level: "info"

positions:
  filename: /tmp/positions.yaml

# This bit indicates what Loki instance to write the logs to. We’ll inject the
# details and credentials through environment variables
clients:
- url: https://${LOKI_TENANT_ID}:${LOKI_TOKEN}@${LOKI_HOST}/loki/api/v1/push

scrape_configs:
# Job name, that will be injected in each log line
 - job_name: ${JOB_NAME}

# Apply relabel to keep Heroku internal labels
relabel_configs:
- source_labels: ['__heroku_drain_host']
      target_label: 'host'
- source_labels: ['__heroku_drain_app']
      target_label: 'app'
- source_labels: ['__heroku_drain_proc']
      target_label: 'proc'

# Main heroku target configuration
  heroku_drain:
    server:
      http_listen_address: 0.0.0.0
      # $PORT is a special environment variable that Heroku fills with
      # port that’s accessible from outside the container. We indicate promtail
     # to listen for Heroku logs in it.
      http_listen_port: ${PORT}
      log_level: info
  # Tag each log entry with our job name
    labels:
      job: ${JOB_NAME}
Docker file
from grafana/promtail:main-c9ef062

# Copy the config.yml file we created in the step above, inside the container itself. This simplifies the
# configuration of the Promtail instance.
COPY config.yml /etc/promtail/config.yml

# This three flags indicates promtail where the configurations is located, to interpolate the configuration
# file with environment variables (this is to avoid hardcoding values such as API Keys), and lastly, to print
# the whole configuration file to STDERR when starting the container (this is helpful for debugging).
CMD ["-config.file=/etc/promtail/config.yml", "-config.expand-env=true", "-print-config-stderr"]
Now that we added the necessary configuration files to the repo, let’s persist the changes:
git add .
git commit -m "Adding necessary promtail configuration files"
Lastly, let’s configure the necessary environment variables in the Heroku application. One important thing to keep in mind is that the JOB_NAME should be a prometheus compatible name.
heroku config:set JOB_NAME=
heroku config:set LOKI_HOST=
heroku config:set LOKI_TENANT_ID=
heroku config:set LOKI_TOKEN=
Now we are ready for our Promtail Heroku app to be deployed. Since we created this application using Heroku’s Git model, we can deploy the app by simply running:
git push heroku main
When pushing to Heroku’s Git repository, you will see the Docker build logs. Once it has completed, run the following to tail the Promtail logs:
heroku logs --app promtail
…
2022-08-30T20:22:00.998373+00:00 app\[web.1]: level=info ts=2022-08-30T20:22:00.998331535Z caller=target.go:67 component=heroku_drain msg="starting heroku drain target" job=<JOB_NAME>
…
If the output is similar to the one above, Promtail is up and running. Let’s send some logs.
Send logs from our app to Promtail
Now that we’ve deployed Promtail, we just need to indicate Heroku to send our application logs to Promtail.
First, we need to find the URL where Heroku hosts our Promtail instance. You can find it by running heroku apps:info --app promtail and look for the Web URL field. We will refer to this as Promtail URL. An example output of this command is the following:
=== promtail
Auto Cert Mgmt: false
Dynos:          web: 1
Git URL:        https://git.heroku.com/promtail.git
Owner:          pablo.balbi@grafana.com
Region:         us
Repo Size:      0 B
Slug Size:      0 B
Stack:          container
Web URL:        https://promtail.herokuapp.com/
Now, we are ready for setting up our Heroku Drain:
heroku drains:add <Promtail URL>/heroku/api/v1/drain --app <RealApp name>
Test everything
First, interact with RealApp for it to generate some logs. After, you can log into your Grafana instance and through Explore:
- Select your Grafana Loki data source
- Run a simple query just looking to the JOB_NAME you picked:
{job="JOB_NAME"}
You should be able to see some logs from RealApp:

Learn more about the Heroku Drain, Grafana Loki, and Promtail
That’s it! Now every log line that is produced by RealApp will be shipped to Grafana Loki.
Note that throughout this tutorial, we have used a Grafana Cloud-hosted version of both Grafana and Grafana Loki, but this setup can be achieved with any deployment of both. Also, it’s not necessary to host a Promtail inside a Heroku application. As long as the hosting environment provides a public URL for Heroku to reach the Promtail deployment, you are good to go.
To learn more about the Heroku Drain, check out our Promtail Heroku Scraping docs and Promtail Heroku target configuration docs.
If you’re not already using Grafana Cloud — the easiest way to get started with observability — sign up now for a free 14-day trial of Grafana Cloud Pro, with unlimited metrics, logs, traces, and users, long-term retention, and access to one Enterprise plugin.

