How to deploy the Grafana stack using Podman
You may be asking yourself: What exactly is Podman?
Podman is short for Pod Manager and is a daemonless, open source container engine alternative to Docker that allows for rootless containers. Podman is available for Linux, Mac, and Windows operating systems.
It only requires a simple and easy install on RPM-based Linuxes, such as Red Hat Enterprise Linux, CentOS, Rocky, or AlmaLinux. It is built to run OCI-compliant container images built using all your favorite existing container build tools such as Buildah, Docker, or even Podman itself. It is even a fully functional drop-in replacement for Docker, and the Podman command can even be aliased to Docker due to its full Docker-compatible CLI interface.
In this blog post, I will show you how simple it is to deploy the complete Grafana LGTM stack — Loki, Grafana, Tempo, and Mimir – via containers using Podman. The set up outlined below is applicable to OSS users as well as Grafana Enterprise users.
Server configuration
We will start with a fresh host running any of the flavors of Linux listed above. First, we will start by updating the packages installed out of the box and doing a reboot using the following commands.
sudo dnf update -y && sudo rebootNext we will make sure we have Podman installed. You can do this by running the following command:
sudo dnf install -y podman Grafana stack deployment
Once we have our container engine installed, we will want to move onto deploying the Grafana stack. We could use podman run commands to start each individual container, much like using docker run. We could even create an alias Docker to Podman and use the exact same commands. The real benefit of Podman is we can create Kubernetes-style pods with multiple containers using the same deployment yaml format that is used on Kubernetes clusters. This functionality is similar to Docker-compose but Kubernetes compatible as well!
I have written an example yaml file for our deployment today, which you can find in this github repository to make it a super quick deployment for you. To start the deployment, we first want to clone the repo linked above using the following.
git clone <https://github.com/CastawayEGR/grafana-stack-podman>After we have cloned the repository, we need to change the directory into the grafana-stack-podman folder and spin up our containers using Podman and the provided yaml configuration file.
podman play kube grafana-stack.yamlWe can verify the pod with all 4 containers is running with this command.
podman psIf all went well, you should see something like the following in your terminal windows:

Next, we can expose Grafana, Grafana Mimir, Grafana Loki, and Grafana Tempo using firewall-cmd.
sudo firewall-cmd --permanent --add-port={3000/tcp,3100/tcp,4317/tcp,4318/tcp,9009/tcp,9095/tcp,9096/tcp,9097/tcp,9411/tcp,14268/tcp} && sudo firewall-cmd --reloadConfiguring Grafana with our data sources
Once Grafana, Grafana Mimir, Grafana Loki, and Grafana Tempo are exposed, we can now browse in our Grafana deployment by visiting the IP address of the machine it is running on and adding :3000 to the end. (i.e., http://192.168.10.10:3100) Once there, we can login with the default credentials:
Username: admin
Password: admin
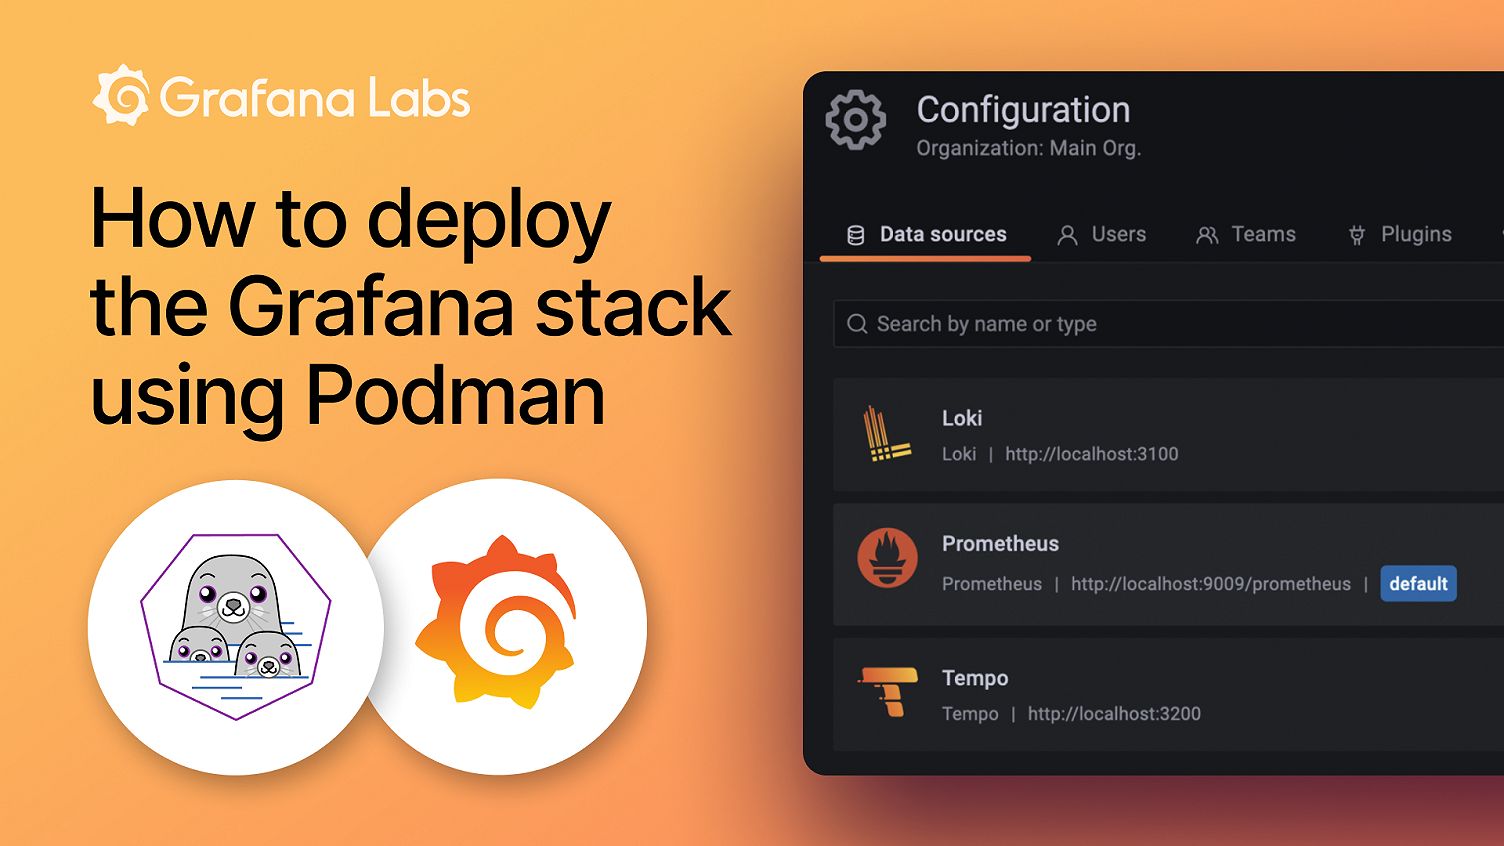
Next up, we want to add our metrics, logs, and traces stores by adding them as data sources. You can do this by clicking the gear icon in the lower left hand corner once logged into Grafana and clicking Add data source. When configuring the Prometheus, Grafana Loki, and Grafana Tempo data sources, you will want to configure them with the ports we exposed and the end result will look something like this.

And that’s all! You can see exactly how simple it is to stand up the entire Grafana stack using containers via the monolithic deployment option, whether this be for local testing/development purposes or proof of concepts. With the Grafana stack fully up and operational, we are ready to start sending these backends our metrics, logs, and trace data from our systems and applications by writing to them directly or using something like the Grafana Agent.
For more information about Grafana Enterprise, check out our on-demand webinar “Getting started with Grafana Enterprise and observability” or contact our team.