
How to reduce MTTR with Grafana Loki and Grafana Tempo: Inside the Houzz observability renovation
Houzz is where millions of homeowners and home improvement professionals go to seek inspiration and supplies for their remodeling projects. But to continue as the leading platform for home remodeling and design, the Houzz tech stack needed a renovation of its own as the company scaled. In response, the Houzz team began by revamping their monoliths into microservices.
As Houzz continued growing, and more and more data was streaming in, the DevOps team realized it also needed to overhaul its legacy observability tooling to enhance log visibility and search. The DevOps and developer teams productivity was faltering because they were spending too much time sifting through logs to find the root cause of production system issues that required their immediate attention.
Yoram Kruvi, DevOps lead at Houzz, set out to find a new observability tool, one with a “keep-it-simple approach.” That’s why Houzz chose Grafana Loki.
“Before we started using Loki, searching for logs was a challenge,” Kruvi says. “The one-stop-shop experience with Grafana gives us the ability to cross-reference data with application workload and infrastructure metrics, which saves us time and makes our search for relevant logs much easier.”
Implementing Grafana Loki took the team five minutes to get up and running from a Helm chart into a Kubernetes cluster. Plus, because of the huge and active Grafana community, Kruvi knew he could find answers quickly if there was any trouble getting started.
“If I have a question that can be answered by Google search, it’s worth everything,” says Kruvi.
A window into traces with Grafana Tempo
With the addition of microserves to the tech stack, network observability problems soon surfaced. So building on the foundation the Houzz team had with Grafana Loki, they turned to Grafana Tempo as their tracing tool of choice to better understand how these new services were communicating with one another.
Traditionally, Houzz has used a Zipkin server for their tracing data and analysis. But when Grafana Tempo was released, the DevOps team decided to give the new open source solution a try based on the performance of Grafana Loki.
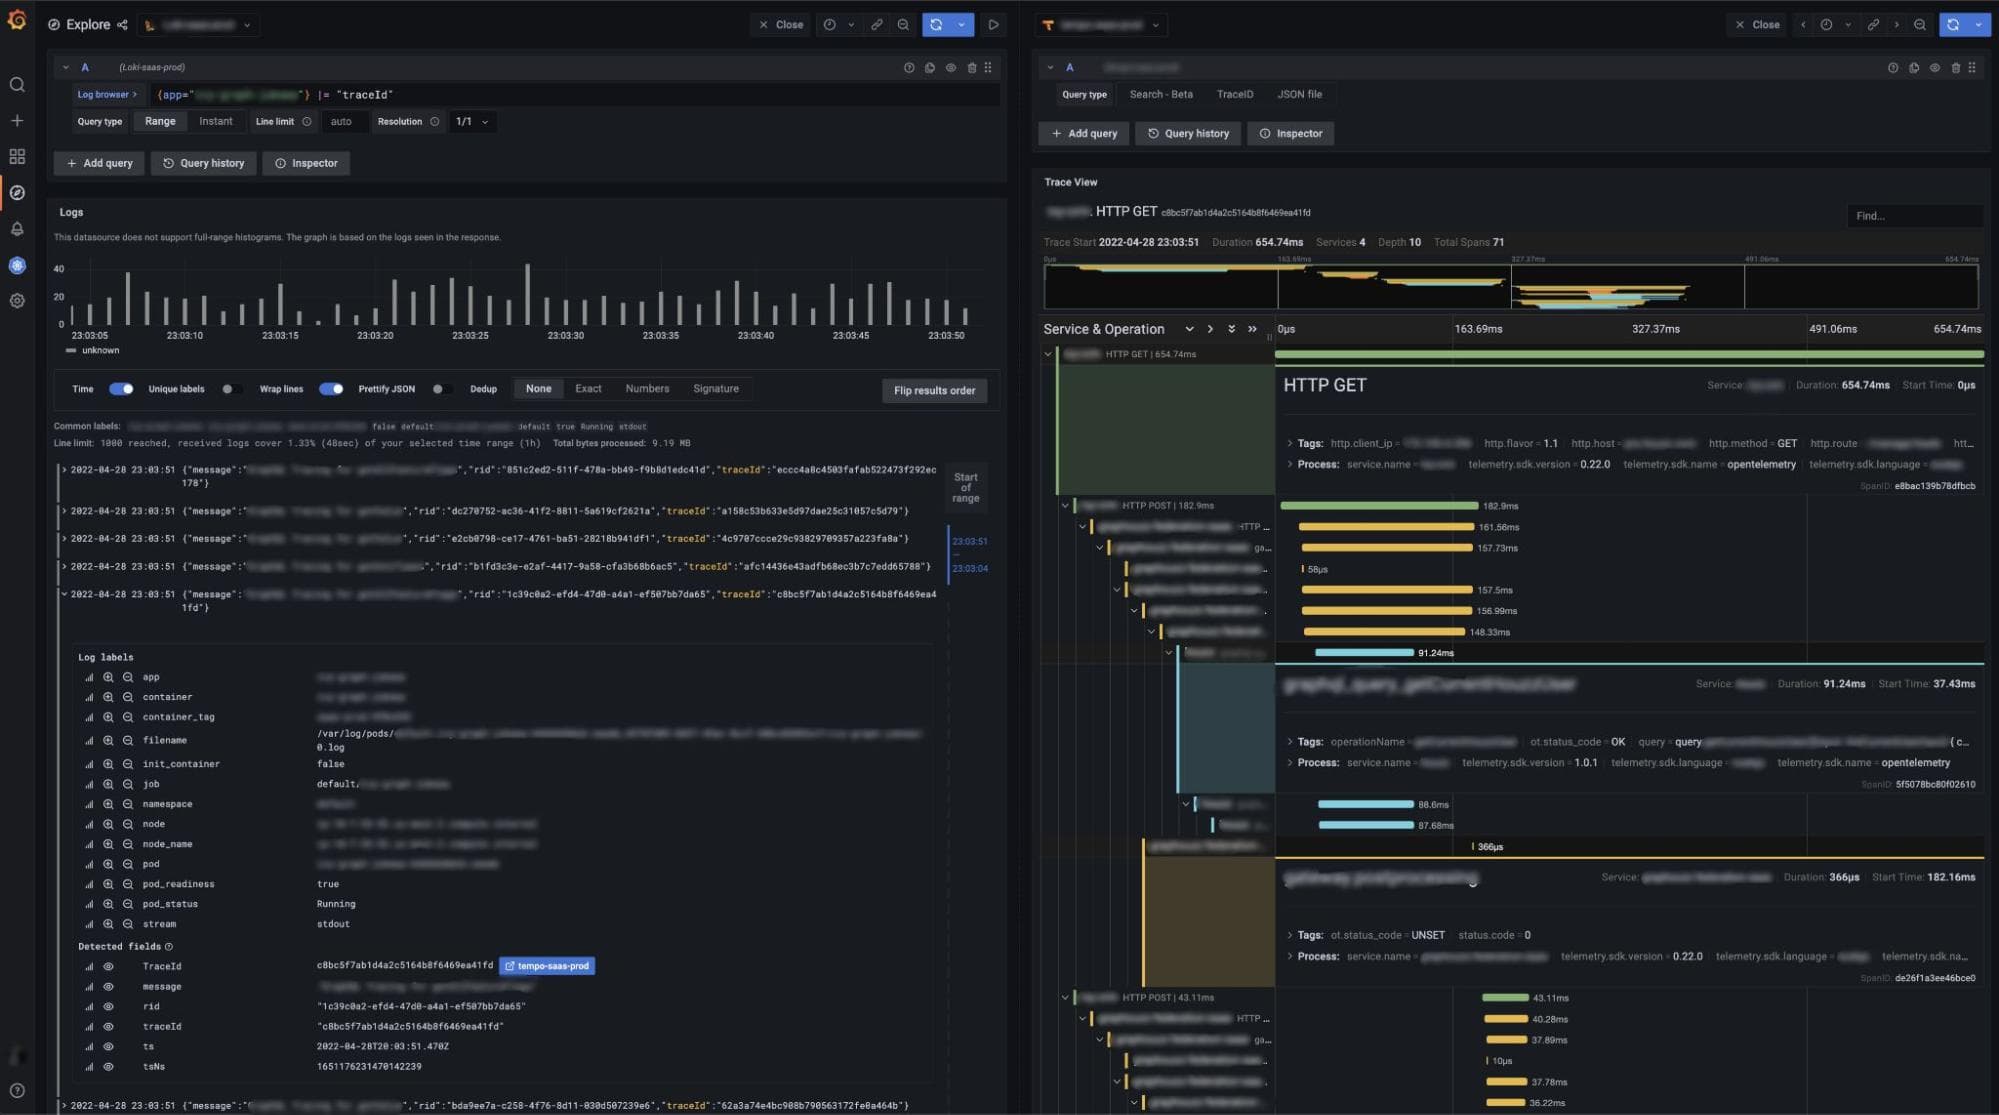
“Having the ability to connect logs found in Grafana Loki directly to the traces in Grafana Tempo, all on the same screen, simplifies the debugging process,” says Roman Vogman, DevOps engineer at Houzz.
Vogman also points out that Grafana Tempo, which was adopted across the Houzz enterprise, is cost efficient because it only requires object storage to operate. Best of all, it is deeply integrated with Grafana Loki.
“You can easily go from metrics to logs to traces, and back again,” says Vogman.
The building blocks to a successful future
By embracing Grafana tools and keeping their observability strategy under one roof, uptime has increased and MTTR and MTTI have decreased at Houzz.
“We don’t need to rely on multiple systems. With Grafana, all the data and metrics are in front of our eyes in the same system and with the same views,” says Kruvi.
This, in turn, has led to an increase in developer satisfaction — not to mention enhanced customer satisfaction. Says Kruvi: “With the correlation of Prometheus, Tempo, and Loki data, we were able to put our fingers on real issues in the system, track them end-to-end, fix them, and see the recovery and improvements immediately.”
Learn more about Houzz’s blueprint for observability in their full success story.
Grafana Cloud is the easiest way to get started with metrics, logs, traces, and dashboards. We have a generous free forever tier and plans for every use case. Sign up for free now!

