

How adding Kubernetes label selectors caused an outage in Grafana Cloud Logs — and how we resolved it
Hello, I’m Callum. I work on Grafana Loki, including the hosted Grafana Cloud Logs offering. Grafana Loki is a distributed multi-tenant system for storing log data — ingestion, querying, all that fun stuff. It also powers Grafana Cloud Logs.
The outage outlined in this blog post was caused during a step in the migration of one of our Grafana Cloud Logs clusters, which we were migrating off of a separately deployed key-value store that was used to store the ring in order to make use of embedded memberlist. The goal was to remove a single point of failure in the form of this key-value store.
As part of writing the migration-related configuration code, we accidentally added an additional Kubernetes label selector, which resulted in incorrect service discovery resolution for pods without that label selector. This led to an overwhelming load being directed to the few pods with the label selector, bringing down our writes path in one of our Grafana Loki environments for ~25 minutes.
This blog post explains what happened, how we responded to it, and what we’re doing to ensure it doesn’t happen again.
Background
To understand how this outage came about, you need to know a bit of background information.
Our deployments of Grafana Loki use a microservices architecture in order to allow for fine-grained tuning of various components based on customer usage and available resources.
You can read more information about Loki’s microservices architecture, but the relevant components are as follows:
- Distributor: Used to validate things like rate limits, correctness of labels data, etc. as well as duplicating of incoming write data for replication purposes.
- Ingester: This is the component that the distributor writes to. The distributor picks a number of ingesters based on the configured replication factor and the hash of an incoming log stream’s labels and writes the data to those ingesters. The ingesters keep the data in-memory for a period of time for faster querying of that data and then eventually writes the data as files to blob storage.
- Ring: The ring is a distributed hash table used by various components within Grafana Loki to know which replicas of a component exist and for deciding which to send to, such as a distributor deciding which ingesters to write data to.
- Gateway: An API gateway-like component that is also responsible for enforcing authentication and communicates with the Kubernetes API to discover distributors.
About Kubernetes label selectors
Here’s the short explanation: Kubernetes allows for attaching metadata to various objects (pods, services, etc.) as a way to organize and identify these objects through its API.
In the case of Kubernetes services, you can tell Kubernetes to select pods that only have a specific label; this is referred to as a selector. You may create a deployment of “applicationX” and attach a label to it, and then have a service that checks for that label in order to confirm that it has only found pods from that deployment with the correct label. You can also use selectors in combination with kubectl commands to target certain pods for adhoc commands.
In our case, we use the labels and selectors to target all pods running memberlist (label gossip_ring_member: 'true' ) and create a Kubernetes service gossip_ring that all pods use in order to join the memberlist cluster via join_members here.
See the Kubernetes docs for more details about Kubernetes label selectors.
Our Kubernetes configuration management
At Grafana Labs, we use jsonnet and Grafana Tanka for configuration and deployment of our services to Kubernetes. We have a number of libraries that have been created at various points within the company’s history and, as you can imagine, it can be hard to guarantee usage consistency or feature availability in some of these libraries, especially across teams.
We have a function that simply looked at the code to configure a deployment or statefulset and generated a service definition for it by copying all the labels attached to the deployment/statefulset and creating selectors for those labels on the service. This function has since been updated to accommodate edge cases, including the one discussed in this blog post.
The incident
This incident was caused by a combination of a few things. First, the creation of a Kubernetes service for a deployment adding a selector for all labels. At the time, I failed to notice that another team had already flagged this issue, and I didn’t provide the new optional parameter to the constructor function (fixed here) to filter out some labels selectors. Second, the new/updated Kubernetes service resulted in the addition of a new label to the deployment and service for our distributor component. Finally, this all meant that the Kubernetes service for distributors would only resolve to pods with this new label.
Step 1 of our migration from the existing KV store to memberlist resulted in the addition of this new label to the distributor pods and service, along with a minor config change. This meant that a rollout was required, and Kubernetes started to roll pods based on our rollout strategy. At this point, our gateway service, which checks authentication and then forwards writes data onto the distributors, was ONLY able to see the new pods since they were the ones that had the new label and the distributor service had the selector to filter pods.
We ended up sending 100% of our write traffic to 10% of our distributors. The result was a loop of these new distributors coming up, receiving too much load based on their CPU and memory limits, being Out of Memory (OOM) killed, and as a result, they were not able to complete their health and readiness checks. These are the checks that Kubernetes uses to determine that the previous set of pods it rolled out are healthy and it can restart the next set of old pods. So, the rollout was not able to continue and start up more pods with this new label, meaning the same 10% of distributors continued to get hammered.
Luckily, we were able to begin recovering before even identifying the problem. Compute costs are cheaper relative to lengthy service outages, and in the case of an outage that seemed to be the result of OOM crashes, our first instinct was to scale the distributor deployment horizontally, adding more replicas. These replicas all came up with the new label and thus were part of the pod IPs the service could resolve to, which meant the load was now spread among more distributors. With fewer distributors OOM crashing, Kubernetes saw more distributors as healthy and continued to roll the old pods. In the end, we reverted the change for this step of the migration to fully resolve the outage and have time to investigate the underlying cause.
The investigation
Luckily we collect tons of metrics and logs from all our services as well as Kubernetes. The first clue that something was off was that kubectl get pods and the Kubernetes metric for the number of pod replicas that have been updated since the last config change showed that only 10% of distributor pods had been restarted. Initially, we thought that because of how log streams are sharded and replicated to certain subsets of pods that there could be a particularly high volume stream that had an increase in throughput, or many more additional streams had been created, and we just happened to deploy at an inopportune time.
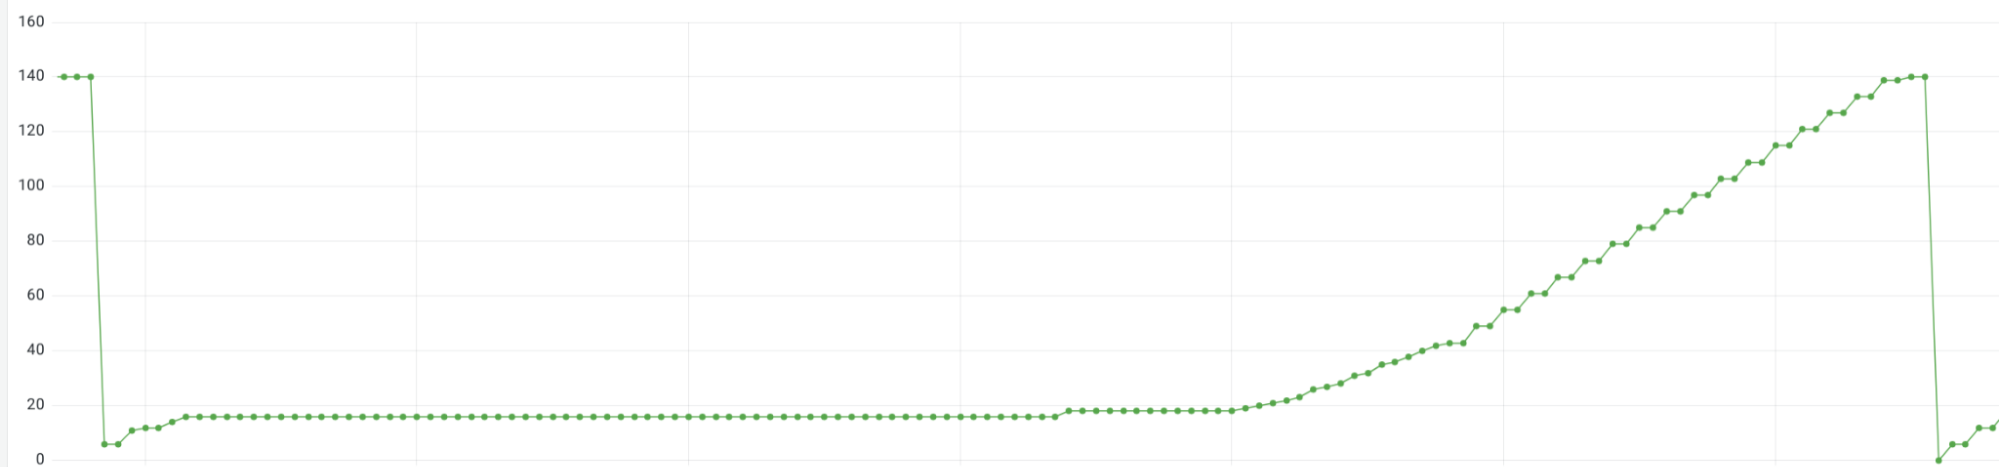
In the graph above, the Kubernetes metric kube_deployment_status_replicas_updated shows that for the duration of our outage, 16/140 distributors were in an “updated” state.
However, again we have metrics for the rate of incoming write requests as well as the number of active streams and neither metric had changed immediately before the incident. We now suspected that something had changed with the routing of requests to distributors and were looking for confirmation. Using the metric loki_request_duration_seconds_count reported by each distributor pod, we could look at the rate of incoming requests for the writes route where the rate was > 0 during the incident and count the number of series, which showed us that 16/140 distributor replicas were receiving write requests.


The graph above is the same loki_request_duration_seconds_count query from above. Here you can see that we essentially have no drop in the number of distributors successfully serving requests since they’re able to quickly start up properly. The baseline near the bottom of the Y-axis of the graph is the 140 amount. The reason the graph goes above 140 is because of the behavior of Prometheus rate queries using time ranges to look back in time.
Now we just needed to find the cause. Luckily we have automation in place to generate diffs between the Kubernetes manifests for all pull requests that will result in changes to any environments. These diffs are posted to PRs and are even stored in a separate repository. Looking at these diffs, we were able to determine that the selector was added to the distributor service and had resulted in the recreation of the distributor service within that Kubernetes cluster/namespace. This is something that is not normally part of any deploys. After reading the documentation for Kubernetes labels and selectors, we knew this was the cause.

Now you may be asking, why didn’t we catch this in a dev or staging environment? This again is due to an oversight on my part. It is not unusual to see a very small (miniscule) amount of errors when we do a rollout in an environment, because of the sheer number of moving pieces that need to communicate with each other but that all start at different times. The added complexity of the ring is a factor as well. Because of this, we saw some minor errors when rolling out the migration in other environments and didn’t think anything was out of the ordinary.
But the reason this same migration step did not cause an outage in another environment is worth noting. It comes down to this particular environment’s distributors being much more horizontally scaled than other environments. Whereas in other environments, especially the ones of a similar size, we include some vertical scaling of the memory limit resource for distributors. In other environments, this meant that there was slightly more time available for the distributors to come up fully and serve the increased percentage of the write load vs. what they normally serve before they would potentially run into their memory limit. In short, Kubernetes was actually able to continue rolling the old distributors to new ones and the load continued to be spread out.
The fix
This was a straightforward fix that involved simply going back to our configuration and noticing that another team had included configuration options in the previously naive creation of a service for a deployment/statefulset to ignore certain labels that were on the deployment/statefulset when creating the service instead of blindly copying them all as selectors onto the service.
TL;DR The fix was to set service_ignored_labels:: [$._config.gossip_member_label], and to pass that to the service constructor k.util.serviceFor($.overrides_exporter_deployment, $._config.service_ignored_labels).
Conclusion
Accidentally adding Kubernetes label selectors to pods as part of our memberlist rollout caused a service that uses Kubernetes services to find distributor pods to DDOS new/updated pods during the rollout. This led to an outage for this cell, since the distributors are more or less the entrypoint for data and queries into the overall Grafana Loki architecture.
Because Grafana Loki is already instrumented with lots of logging, metrics, and even traces, we were able to use those in combination with metrics from Kubernetes to determine what was different during the rollout of memberlist and identify the root cause.
Overall, by publishing this blog post, we hope that others considering deploying using Kubernetes label selectors can learn from our mistakes.