New in Grafana Alerting: File provisioning
We are happy to announce that file provisioning for Grafana Alerting has arrived in Grafana 9.1. This feature enables you to configure your whole alerting stack using files on disk, as you may already do with data sources or dashboards. The Terraform Grafana provider has also been updated to allow the provisioning of Grafana Alerting resources.
How file provisioning works in Grafana Alerting
Upon start-up, Grafana looks in the provisioning directory for any file in the alerting subdirectory. We offer the flexibility to arrange your data in the way that best suits you: You can have a team-based layout where every team has its own file; or you can have one big file for all your teams; or you can have one file per object type – it’s up to your preferences.
After reading the files, Grafana will insert new objects, update changed objects, and delete old ones. Provisioning happens only once during start-up, but if you want to rerun it, you can use the provisioning API to trigger it again.
If you want to know all the details about how to set up the files and what fields are required for each object, you can look at our detailed provisioning documentation for Grafana Alerting.
File provisioning and the Grafana Alerting UI
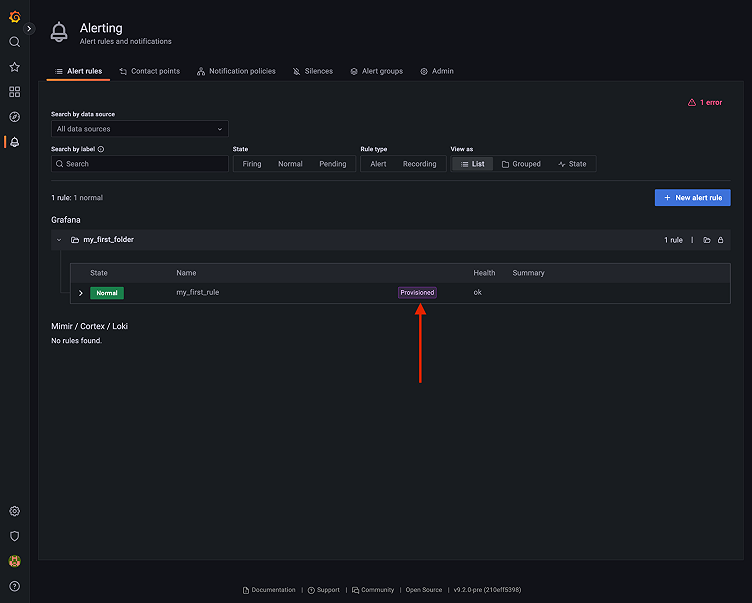
When using file provisioning, objects will be marked in the UI as Provisioned so it’s clear they were not created manually.
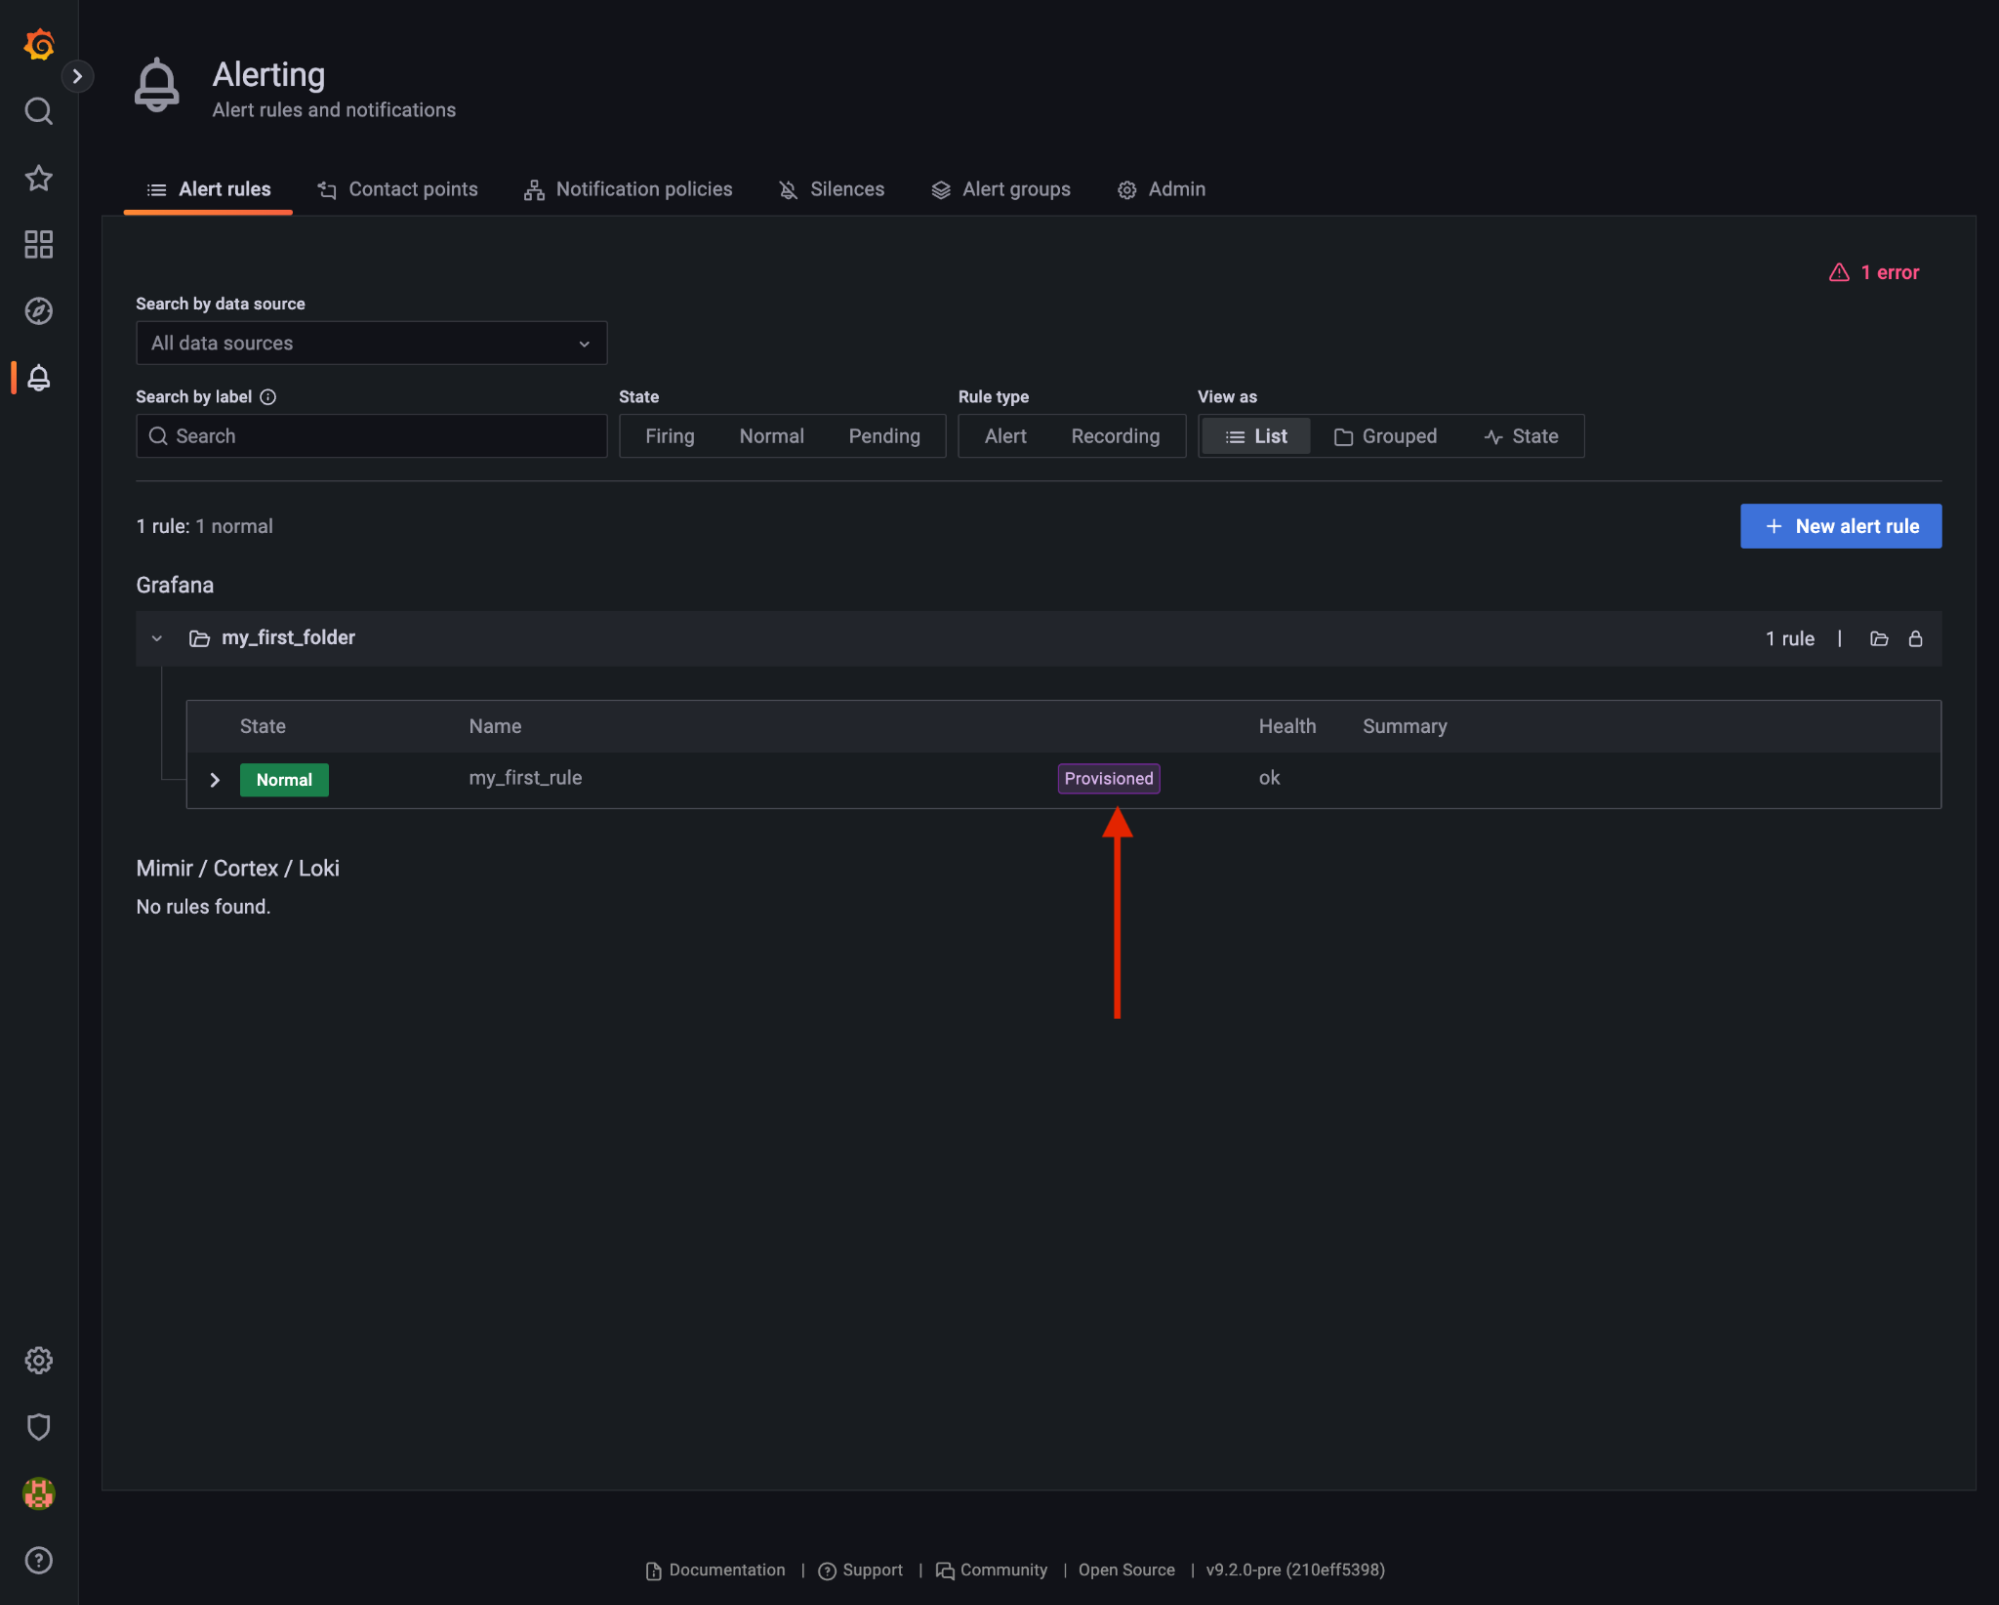
Provisioned objects are immutable; they cannot be edited via the UI. Changing the object’s properties is only possible by changing the provisioning file and restarting Grafana or calling the reload endpoint. This prevents potential changes made to the object through the UI that would get overwritten by the file provisioner on the next start-up or reload.
File provisioning using Kubernetes
If you are one of our many Kubernetes users, you can leverage file provisioning using Kubernetes config maps. Simply create one or multiple config maps as shown below:
apiVersion: v1
kind: ConfigMap
metadata:
  name: grafana-alerting
data:
  provisioning.yaml: |
    templates:
    - name: my_first_template
      template: the content for my template
This config map can be mounted to your Grafana pod and will be read on start-up.
apiVersion: apps/v1
kind: Deployment
metadata:
  name: grafana
spec:
  replicas: 1
  selector:
    matchLabels:
      app: grafana
  template:
    metadata:
      name: grafana
      labels:
        app: grafana
    spec:
      containers:
      - name: grafana
        image: grafana/grafana:latest
        ports:
        - name: grafana
          containerPort: 3000
        volumeMounts:
          - mountPath: /etc/grafana/provisioning/alerting
            name: grafana-alerting
            readOnly: false
      volumes:
        - name: grafana-alerting
          configMap:
              defaultMode: 420
              name: grafana-alerting
This eliminates the need for a persistent database to use Grafana Alerting in Kubernetes – all your provisioned resources will be there after each restart or redeployment.
Disclaimer: A persistent database may sometimes be useful if you need retention for past alerts or similar use cases that need historical Grafana data.
For more information about how you can get started with Kubernetes Monitoring — our full Kubernetes solution in Grafana Cloud with prebuilt dashboards, alerts, and much more — visit the Kubernetes Monitoring solutions page or check out our Kubernetes Monitoring documentation.
Learn more about Grafana Alerting
File provisioning is just one of the many new features and improvements we have introduced since rolling out the updated Grafana Alerting experience in Grafana 9.0. To get started with Grafana Alerting, you can check out our easy-to-follow videos about how to create a Grafana alert, watch our deep dive talk all about Grafana Alerting on demand, or read our robust Grafana Alerting documentation.
If you have any feedback about file provisioning or your Grafana Alerting experience, feel free to open an issue in the Grafana GitHub repository or start a conversation in our Grafana Labs Community Slack!
Grafana Cloud is the easiest way to get started with metrics, logs, traces, and dashboards. We have a generous free forever tier and plans for every use case. Sign up for free now!

