Grafana Tempo 1.5 release: New metrics features with OpenTelemetry, Parquet support, and the path to 2.0
Grafana Tempo 1.5 has been released with a number of new features. In particular, we are excited that this is the first release with experimental support for the new Parquet-based columnar store.
Read on to get a high-level overview of all the new changes in Grafana Tempo! If you’re a glutton for punishment, you can also dig into the hairy details of the changelog.
New features in Grafana Tempo 1.5
Parquet support (experimental)
The headline feature of Grafana Tempo 1.5 is experimental support for Parquet. This new columnar format unlocks the next iteration of Tempo as a distributed tracing backend. This format allows us to pull 5 to 10x less data from the backend per query by focusing only on the columns that are specified in the query. Additionally, this format allows us to move forward with plans for TraceQL, a new trace query language for Grafana Tempo based on Parquet.
We have a long way to go in terms of optimizations and performance improvements using Parquet. However, one promising indicator is that previously we capped out around 40 to 50GB/s searched on the old format. With Parquet, we are currently seeing closer to 300 GB/s searched on common queries with fewer resources used.
If you want to test it out for yourself, enable this new format and share any issues or concerns on our GitHub issues page. We are currently running the new format in a number of internal clusters. The biggest concerns we have at the moment are increased CPU and memory for compactors and ingesters as well as slower compaction.
Let’s all improve this format for the upcoming 2.0!
storage:
    trace:
        block:
            version: vParquet
To get the most out of Parquet querying, we recommend adjustments to your querying config as well:
querier:
  max_concurrent_queries: 100
  search:
    prefer_self: 50   # only if you're using external endpoints

query_frontend:
  max_outstanding_per_tenant: 2000
  search:
    concurrent_jobs: 2000
    target_bytes_per_job: 400_000_000

storage:
  trace:
    <gcs|s3|azure>:
      hedge_requests_at: 1s
      hedge_requests_up_to: 2
Usage reporting
Next we need to mention the addition of usage reporting in Grafana Tempo. This feature allows us to better understand how people are making use of Tempo. With this information, we can better focus our development efforts on the features and scales that are most in use by the community. We also understand that not everyone wants to report this data back to the mothership. Disabling usage reporting is as simple as setting the following in your configuration files:
usage_report:
  reporting_enabled: false
Extending metrics generator
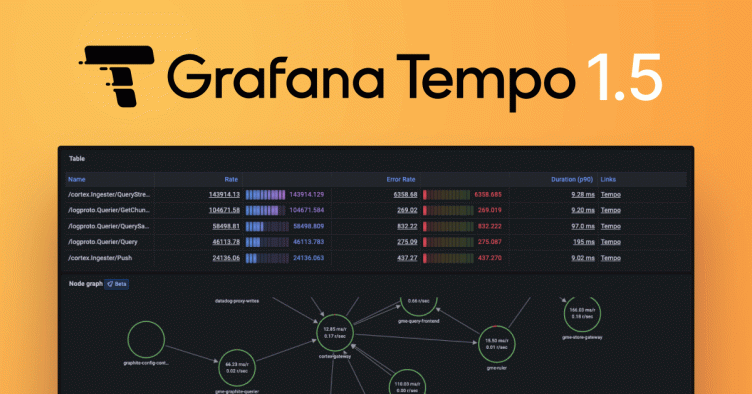
The final important feature I’d like to call attention to in Grafana Tempo 1.5 is the addition of queues and databases in service graph metrics. Tempo uses standard tags defined by OpenTelemetry semantic conventions to generate metrics representing the role of queues and databases in your service graphs.
Also, while we’re on the subject of service graphs, please check out the latest and greatest work the Grafana team has been doing using Tempo server-side metrics.

Bug fixes
We can’t have software without at least a few bugs.
- PR 1441 Fix nil pointer panic when the trace by id path errors.
- PR 1468 Fix race condition in forwarder overrides loop.
- PR 1548, PR 1538, PR 1589, Various backend and wal search fixes.
- PR 1258 Prevent ingester panic “cannot grow buffer”
- PR 1554 metrics-generator: do not remove x-scope-orgid header in single tenant modus
- PR 1603 Fixed ingester to continue starting up after block replay error
Breaking changes
Grafana Tempo 1.5 has several breaking changes.
- PR 1478 In order to build advanced visualization features into Grafana, we have decided to change our span metric names to match OTel conventions. This way any functionality added to Grafana will work whether you use Grafana Tempo, Grafana Agent, or the OTel Collector to generate metrics. Details in the span metrics documentation.
traces_spanmetrics_duration_seconds_{sum,count,bucket}becomes
traces_spanmetrics_latency_{sum,count,bucket}- PR 1556 Jsonnet users will need to specify ephemeral storage requests and limits for the metrics generator.
- PR 1481 Anonymous usage reporting has been added. Distributors and metrics generators will now require permissions to object storage equivalent to compactors and ingesters. This feature is enabled by default but can be disabled easily.
- PR 1558 Deprecated metrics
tempodb_(gcs|s3|azure)_request_duration_secondshave been removed in favor oftempodb_backend_request_duration_seconds.
What’s next in Grafana Tempo?
Grafana Tempo 2.0, I guess? We’re running out of excuses not to cut Tempo 2.0, so let’s do it! Our engineers are working hard on a few fronts to make this possible. First, we need to marry the TraceQL parser to the Parquet format. Secondly, we need to rewrite our WAL code to use Parquet instead of the current proto format to allow TraceQL searches to hit the WAL. This is on my to-do list, so I suppose I should wrap this blog post up, put on some music, and get back into it!
Happy tracing!
If you are interested in more Grafana Tempo news or search progress, please join us in the Grafana Labs Community Slack in the #tempo channel, post a question in our community forums, reach out on Twitter, or join our monthly community call. See you there!
And if you want to get even closer to where the magic happens, why not have a look at our open positions at Grafana Labs?
The easiest way to get started with Grafana Tempo is with Grafana Cloud, and our free forever tier now includes 50GB of traces along with 50GB of logs and 10K series of metrics. You can sign up for free.


