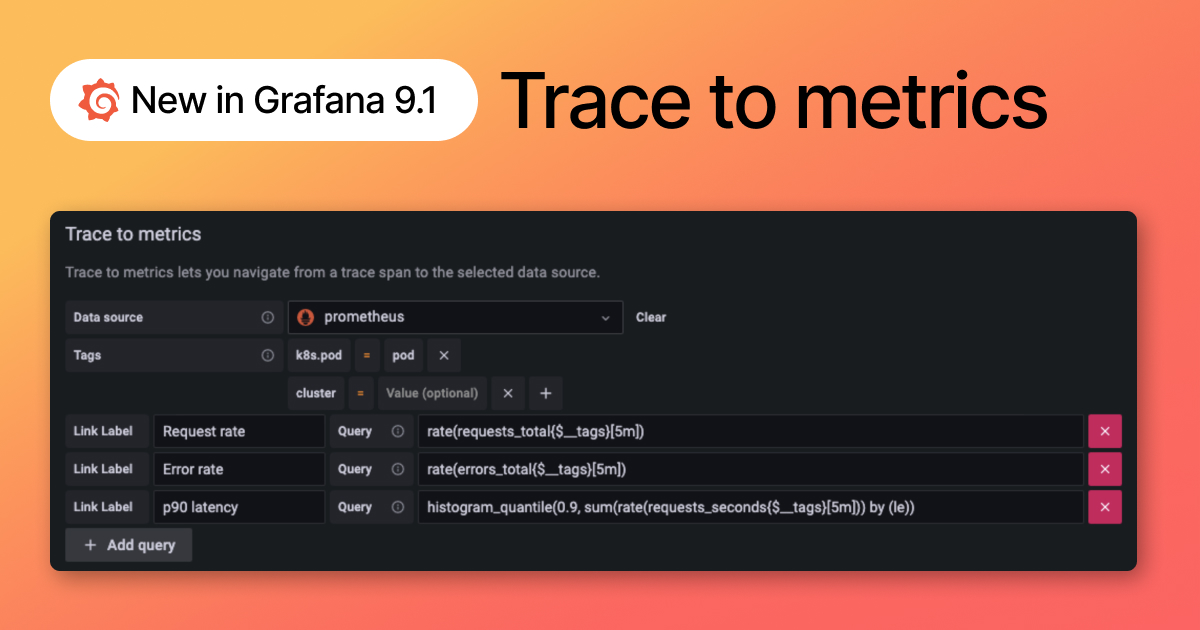
New in Grafana 9.1: Trace to metrics allows users to navigate from a trace span to a selected data source
Traces, logs, and metrics provide inherently different views into a system, which is why correlating between them is important. With features like exemplar support, trace to logs, and span references, you can quickly jump between most telemetry signals in Grafana.
With the release of Grafana 9.1, we’re improving Grafana’s ability to correlate different signals by adding the functionality to link between traces and metrics. The trace to metrics feature, which is currently in beta, lets you quickly see trends or aggregated data related to each span. You can try it out by enabling the traceToMetrics feature toggle in your Grafana configuration file, and you can learn more in our trace to metrics documentation.
There’s supposed to be a video here, but for some reason there isn’t. Either we entered the id wrong (oops!), or Vimeo is down. If it’s the latter, we’d expect they’ll be back up and running soon. In the meantime, check out our blog!
How trace to metrics works in Grafana
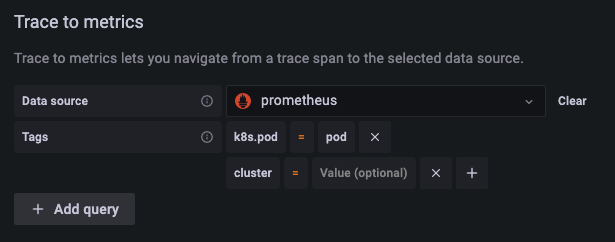
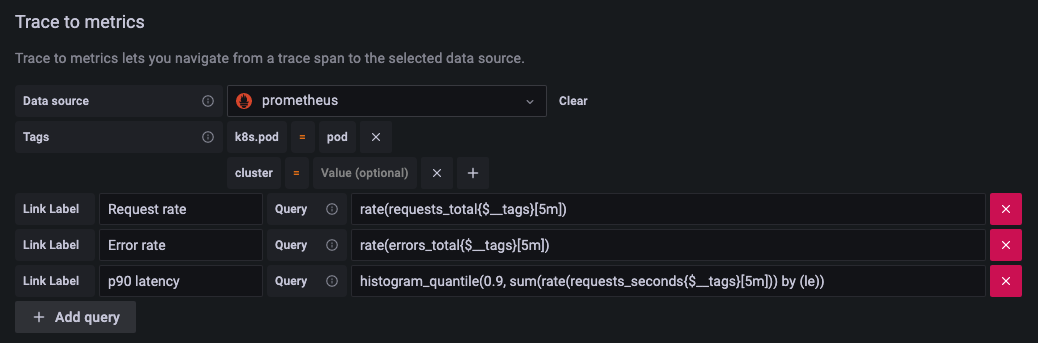
Configure your tracing data source
To set up trace to metrics, edit your tracing data source configuration. Start by selecting the Prometheus data source you’d like to link to.
Next, configure the tags you’d like to include in the linked queries. For each tag, the key is the span attribute name. In cases where the attribute name would result in an invalid metrics query or doesn’t exactly match the desired label name, you can enter the label name as the second value. For example, you could map the attribute k8s.pod to the label pod.
Finally, add your linked queries. Each linked query consists of an optional link label and query. The query will run when navigating from a trace to the linked metrics data source.
You can interpolate the configured tags using the $__tags keyword. For example, when you configure the query requests_total{$__tags} with the tags k8s.pod=pod and cluster, it results in requests_total{pod="nginx-554b9", cluster="us-east-1"}. The label values will be dynamically inserted based on the span attributes’ values.
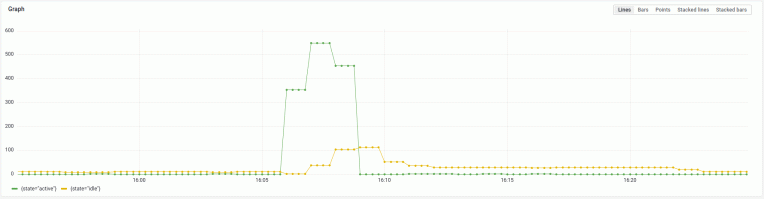
You can link to any metric you’d like, but metrics for span durations, counts, and errors filtered by service or span are a great starting point. The metrics generator introduced in Tempo 1.4 pairs extremely well with trace to metrics because it generates metrics which are highly correlated to your traces. Learn more about the metrics generator.
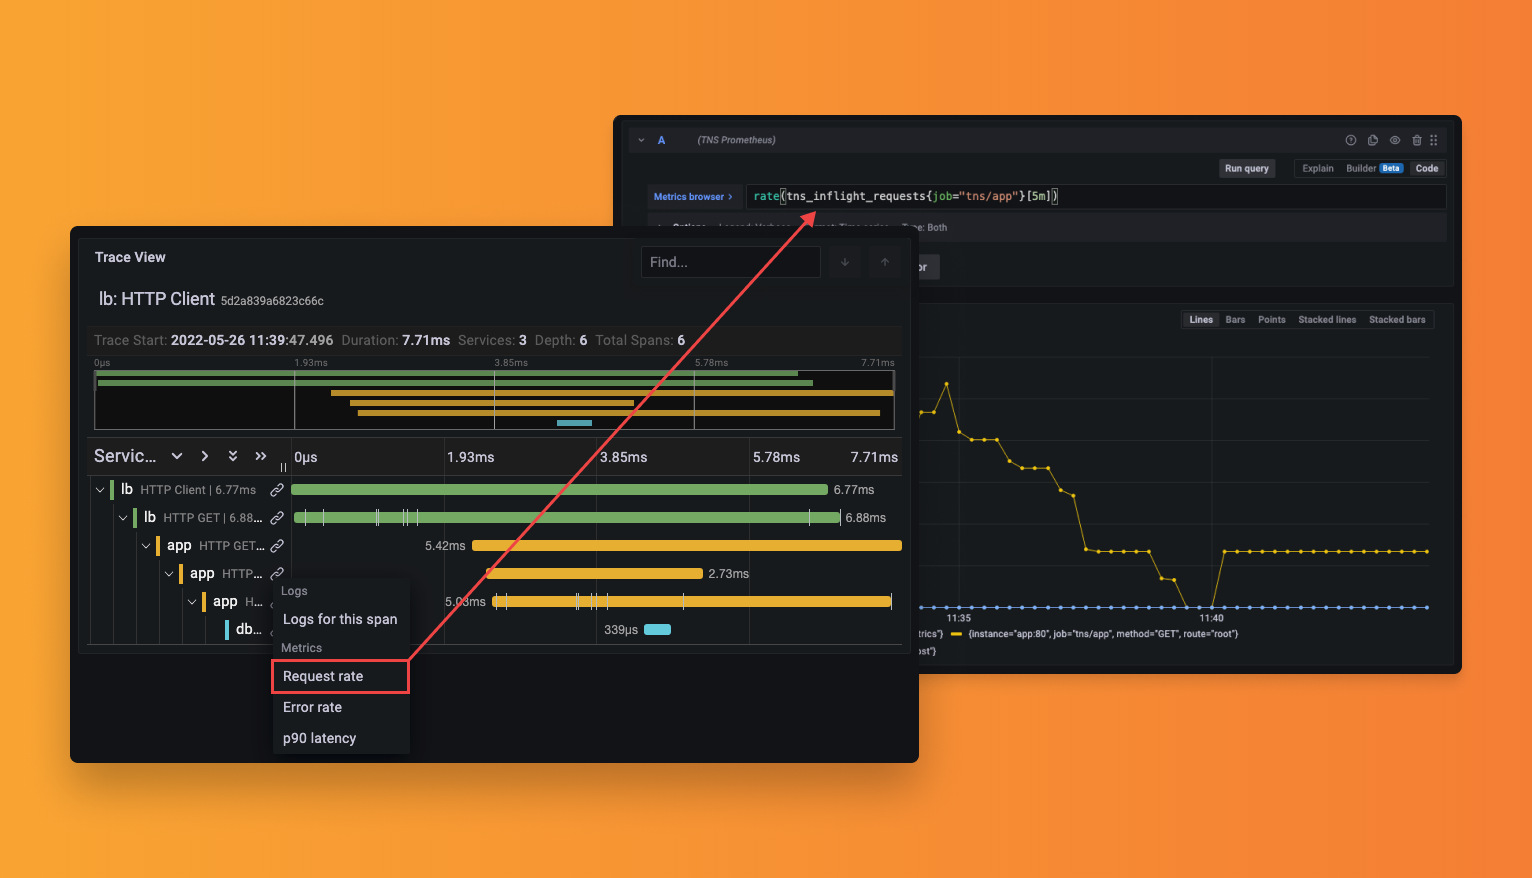
View links in Explore
Navigate to Explore and query a trace. Each span will now have links to your queries. Clicking a link will run the query in a split panel. If tags are configured, Grafana will dynamically insert the span attribute values into the query. The query will run over the time range currently selected in Explore.
What’s next?
We need your help exploring additional use cases and workflows for trace to metrics in Grafana. We’re looking to support additional metrics data sources and improve the ease and flexibility of the query configuration. Enable the traceToMetrics feature flag, test it out, and let us know what you think!
If you have feedback, questions, or suggestions, please join us on the Grafana Labs Community Slack in the #tempo channel or post a question on our community forums.
Happy exploring!
Grafana Cloud is the easiest way to get started with metrics, logs, traces, and dashboards. We have a generous free forever tier and plans for every use case. Sign up for free now!