Using Grafana and machine learning to analyze microscopy images: Inside Theia Scientific's work
At GrafanaCONline 2022, Theia Scientific President, Managing Member, and Lead Developer Chris Field and Volkov Labs founder and CEO Mikhail Volkov — a Grafana expert — delivered a presentation about using Grafana and machine learning for real-time microscopy image analysis.
Real-time microscopy image analysis involves capturing images on a microscope using a digital device such as a PC, iPad, or camera. Researchers then use the images to count or measure the size of certain features contained in it. It’s a technique used for manufacturing and quality control, as well as in academic research and more.
Field explained that by combining machine learning, computer vision, and Grafana, they were able to automate workflow to enable real-time or “live” analysis of microscopy images. It reduced labor costs by 80% in some instances, and helped delivered analysis results in seconds rather than years or months.
Seeing the future
Field began by showing what they hope the future of real time microscopy image analysis will look like.

On the right is an image from an electron microscope. The red boxes are automatically being drawn on top of the microscope control software to count and size the black dots. The top left panel shows the number of defects in the sample as it’s being examined, while the panel on the bottom left shows the defect size increasing over time — details a researcher might be looking for.
Currently, Field said, microscopy image analysis is a “manual, laborious, time-consuming, and tedious process.” The boxes are drawn by hand, which means counting, measuring, and highlighting details in one image could take up to 20 minutes — and that gets multiplied by thousands of images over multiple sessions.
He went to on to explain that microscopy image analysis has several other unique workflow and environmental challenges, including the fact that some microscopes are in locations without Internet access. Still, since people are familiar with how to use web browsers and the cloud, they designed a unique solution with that in mind. Their goal was to combine edge computing devices with machine learning and web technologies, he said, “so that we gain the advantages of that familiarity with the cloud infrastructure, but we can also do it in our closed environment.”
The result: The Theiascope concept.

Using Grafana as a platform helped turn that into a reality. Explaining why Grafana was their go-to choice for the project, Field said, “There are visualization, customization, and heterogeneous data sources. That, to me, means Grafana.”
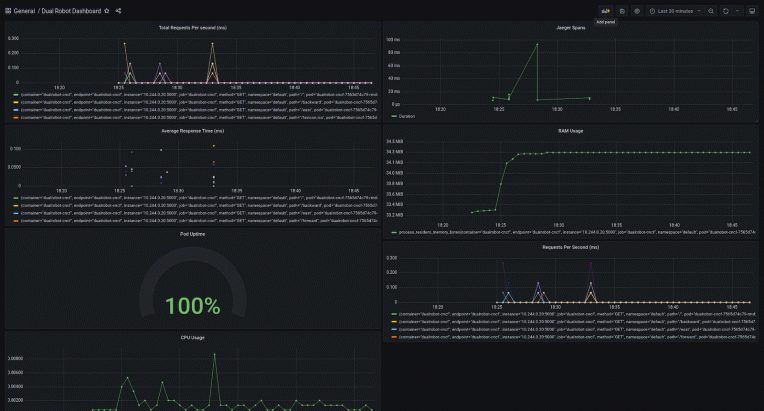
Volkov then took over and discussed the Theia application plugin, which consists of data sources and various panels. He then gave a peek at what the application looks like, beginning with a home dashboard that shows model management, job management, a calendar, CPU, GPU, and disk usage.

The demo
To show the application at work in the acquisition process and real-time streaming, the pair used live cams of New York City and Tokyo, and a YOLO COCO model (available on GitHub), which can identify 80 classes of objects, such as cars, people, and buses.
While one Grafana panel showed the types of objects being found, time series boxes kept track of how well the model was performing and how many different objects it was seeing. Field then demonstrated how he could go back into the dashboard to do a deep dive into what happened in the models.
Volkov took a close look at the “power of the panels,” and highlighted more reasons why they chose Grafana for the Theiascope. Top features include the ability to choose light or dark interfaces (“great for different conditions scientists work in”), the ease of exporting files in real time, and highly customizable features.
Deployments at work
Theia Scientific has deployed the platform at various locations including the Argonne National Laboratory, where they have 11 edge computing devices on a microscope. That means they could run up to 11 models at the same time and have 11 dashboards with the associated information.
The impact is significant: “It’s like having 11 graduate students sitting there furiously drawing little boxes around those black dots,” Field said.
For more on the Theia application, check out Field and Volkov’s recent blog post.
Grafana Cloud is the easiest way to get started with metrics, logs, traces, and dashboards. We have a generous free forever tier and plans for every use case. Sign up for free now!