

Grafana usage insights: How to track who is sending what metrics to your stack in Grafana Cloud
We are happy to announce the release of the Grafana usage groups feature in Grafana Cloud. This new feature — which is available in the Grafana Cloud Advanced plan — helps centralized observability teams and administrators track and attribute metrics usage back to groups that exist within a single shared Grafana stack.
Ultimately, Grafana usage groups can help with governance and cost control. In this post, we’ll show you how you can attribute metrics to different teams in Grafana Cloud.
How to organize and deploy a Grafana stack
In the wild, we see users maintain their Grafana stacks in several ways:
- One shared Grafana stack for the whole organization: Many customers put all their metrics (across many different teams) into a single hosted metrics instance. The benefits of this approach are transparency and simplicity — every user can access all data by default.
- One Grafana stack per team: Some admins deploy one stack per team, division, or business unit. This allows admins to charge back or track the attributed usage to the respective teams. It passes on the responsibility of managing costs to those teams and enables them to manage their costs independently and autonomously.
- One Grafana stack per environment: Some admins have created one stack per environment such as development, staging, and production. Attributing usage for the environment can help a finance team assign direct and indirect costs correctly.
Additionally, before organizing and deploying Grafana stacks within your organization, there are other considerations that should be taken into account:
- Limits are configured per Grafana stack. If a team or environment has a usage spike and hits their limit, other stacks won’t be impacted.
- Data access. By default, when you create a new Grafana Cloud stack, data stored in the hosted metrics backend is accessed through the hosted Grafana instance, as the backend is already configured as a data source there. This can be useful if you want to restrict teams to only see their own data, but if you want teams to be able to view one another’s data (for example, on a single, centrally shared hosted Grafana instance), then an admin will need to manually add the data sources for every metrics backend.
Regardless of your preferred approach, all of these stack models can benefit from usage groups.
Grafana usage insights in Grafana Cloud
Whether you are using multiple stacks or one, you’ll likely benefit from implementing usage groups. Usage groups offer additional dimensions for you to analyze and better understand your metrics usage.
Let’s dive into an example. First we are going to analyze our metric usage for different services. We’ll start by setting up usage groups configuration to create separate groups based on a label called service.
'grafanacloud_usage_group/service_ambassador': '{service=ambassador}'
'grafanacloud_usage_group/service_consul': '{service=consul}'
'grafanacloud_usage_group/service_ingress-ambassador': '{service=ingress-ambassador}'
'grafanacloud_usage_group/service_ingress-nginx': '{service=ingress-nginx}'
The configuration entries are built up as a map of desired group name (prefixed with grafanacloud_usage_group) and a label selector for counting active series.
After adding this configuration for our test account, our usage groups show up on the Billing and Usage dashboard under the Metrics Instance Usage Group Stats row:

Looking closer, we can identify that the service with the most usage in this example is ingress-nginx. To further drill down on how that usage adds up, you would head to the cardinality dashboards.
Note: Active series counts for each usage group will only be available from the moment that the usage group configuration is applied. Metrics ingested before that moment will not be retroactively analyzed or assigned to any usage group.
Next, we are going to introduce another dimension by which we would like to count active series. Our data are coming from multiple environments (dev, prod, staging). Let’s suppose our VP engineering/cloud finance team would like to understand how much we’re spending on dev environments and decide if we should be more efficient with the metrics there.
To do that, we’d modify our usage groups configuration to the following:
'grafanacloud_usage_group/service_ambassador': '{service=ambassador}'
'grafanacloud_usage_group/service_consul': '{service=consul}'
'grafanacloud_usage_group/service_ingress-ambassador': '{service=ingress-ambassador}'
'grafanacloud_usage_group/service_ingress-nginx': '{service=ingress-nginx}'
...
#nothing changed until here
'grafanacloud_usage_group/environment_dev': '{environment=dev}'
'grafanacloud_usage_group/environment_prod': '{environment=prod}'
'grafanacloud_usage_group/environment_staging': '{environment=staging}'
With this modification, the metric usage for each environment also shows up on the same panel:
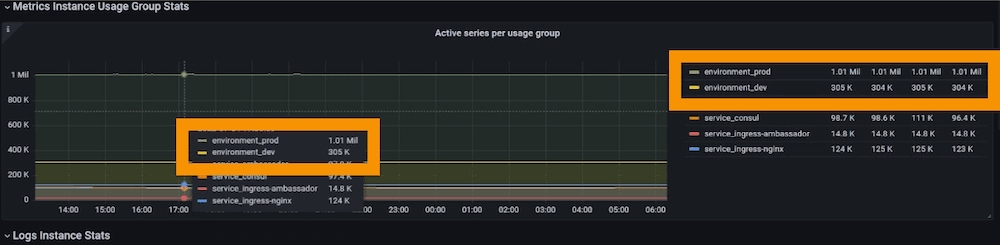
Applying the new configuration shows us that dev is using ~30% of prod’s metric consumption.
Learn more about usage groups in Grafana Cloud
We’re excited to showcase the usage groups feature in Grafana Cloud Advanced and give you a new way to set up and maintain your Grafana stacks based on what makes the most sense for your team or company.
If you are interested in configuring your Grafana stack for usage groups and sharing your feedback, or if you want to learn more about Grafana Cloud Advanced, please reach out to customer support.
Grafana Cloud is the easiest way to get started with metrics, logs, traces, and dashboards. We have a generous free forever tier and plans for every use case. Sign up for free now!

