
New in Grafana Mimir: Ingest Graphite, Datadog, Influx, and Prometheus metrics into a single storage backend
In March 2022, Grafana Labs released Grafana Mimir, the most scalable, most performant open source time series database in the world. Mimir provides significant scale — 1 billion active series and beyond — with easy deployment, multi-tenancy, durable storage, high availability, and super fast query performance.
From launch, Grafana Mimir could natively consume Prometheus metrics. However, the vision for Mimir is not to be just the best, most scalable Prometheus backend, but to be the best, most scalable time series database regardless of the metrics format. Users should not have to change their code to send metrics to Mimir.
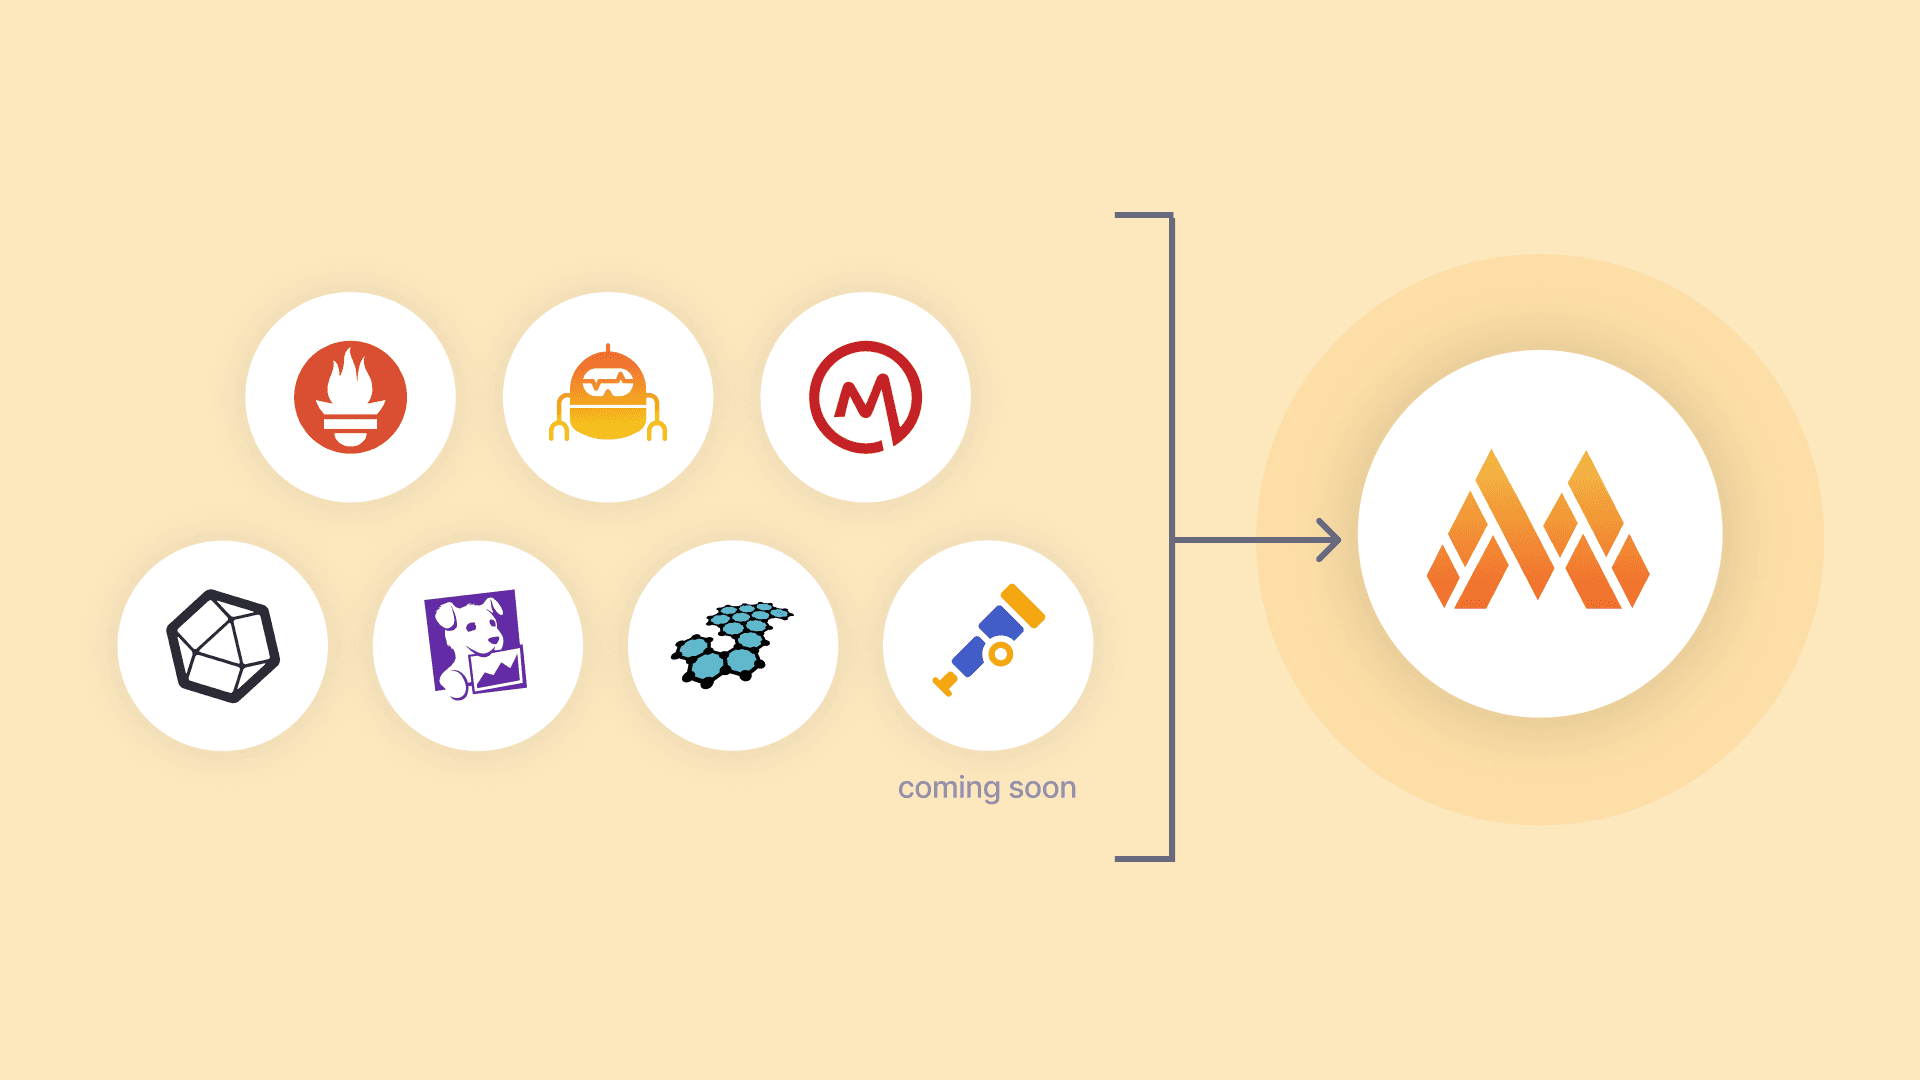
So today, we are open sourcing three write proxies for Mimir that can be used to natively ingest metrics from Graphite, Datadog, and InfluxDB, and store these metrics in Mimir. These proxies, which are labeled experimental in the open source project, allow quick and simple ingestion of metrics using existing monitoring infrastructure — and lay the foundation for Mimir to ingest metrics from any system.
For Grafana Cloud users, the Graphite proxy is already generally available, and InfluxDB will soon follow. (Don’t have a Grafana Cloud account? You can sign up for a free account today!)
What is a Grafana Mimir proxy?
As part of our “big tent” philosophy at Grafana Labs, we want to allow users to ingest data from as many sources as possible, as simply as possible. Just as Grafana is the one tool to visualize all your data, we are building Mimir to be the one tool to store all your metrics.
This is a key component of the Mimir architecture:
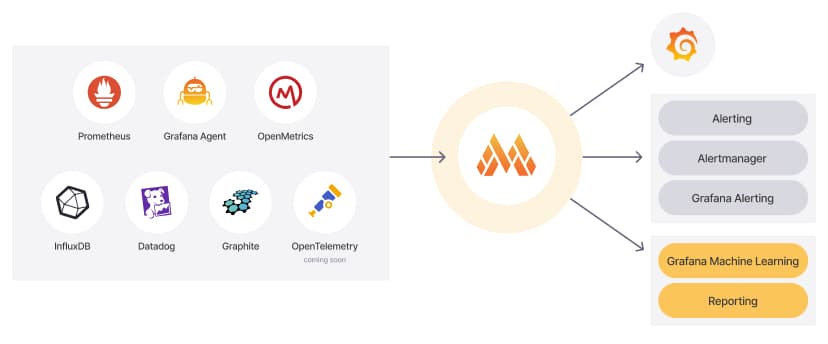
To enable this, the write proxies allow native ingestion of metrics from Graphite and Datadog and via Influx Line protocol. By adding the proxy as an additional endpoint for the collection agent (Datadog Agent, Carbon-Relay-NG, etc.), any metrics will be translated to Prometheus time series and sent in Prometheus remote write format to be stored within Mimir.
The proxies are hosted on GitHub and are currently considered experimental. We invite you to try them out and share your feedback!
Native ingestion of OpenTelemetry’s OTLP metrics is coming soon.
Grafana Mimir proxies: How they work
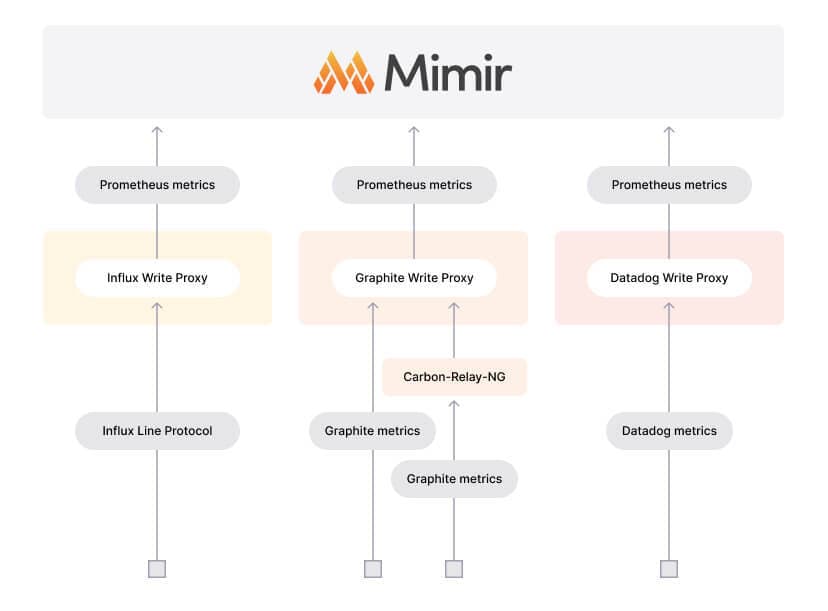
The input to each proxy are metrics sent in the native protocol (Graphite metrics, Datadog metrics, or Influx Line protocol).
Graphite metrics
The Graphite write proxy accepts the ingest requests (usually via Carbon-Relay-NG) and then translates the incoming Graphite metrics into Prometheus metrics. The Graphite-to-Prometheus metrics translation differentiates between untagged Graphite metrics and tagged Graphite metrics, with our proxy supporting both. The name-mapping scheme for each looks like the following:
Untagged Graphite metrics
Graphite metric: some.test.metric
In Prometheus: graphite_untagged{__n000__="some", __n001__="test", __n002__="metric"}
Tagged Graphite metrics
Graphite metric: some.test.metric;my_tag=my_value;another_tag=another_value
In Prometheus: graphite_tagged{name="some.test.metric", my_tag="my_value", another_tag="another_value"}
Dependencies: The Graphite write proxy runs as a standalone binary with no other dependencies.
Datadog metrics
The Datadog write proxy translates incoming Datadog metrics and combines them with any host tags (which Datadog Agent sends separately) to generate Prometheus series that can be forwarded to Mimir. To facilitate the combining of metric/host tags, the Datadog write proxy uses Prometheus itself as the durable storage for the host tags, which is backed by a memcached instance for performance.
A typical setup uses the DD_ADDITIONAL_ENDPOINTS environment variable to tell the Datadog Agent to send its metrics to the Datadog write proxy in addition to its existing targets. To forward Datadog metrics to Grafana Cloud, use the configuration described in the documentation.
The following Datadog endpoints are supported:
/api/v1/series/api/v1/check_run/intake
Datadog metric: rack_fans_speed.1{rack:0x13,shelf:04,pos:FL,pos:RR}, type = GAUGE
In Prometheus: rack__fans__speed_dot_1{rack="'0x13'",shelf="'04'",pos="'FL','RR'", _dot_internal_dot_dd__type="gauge"}
There is a slight incompatibility in the characters allowed in tag/label names between Mimir and Datadog. Some translation is required. Prometheus metric names and labels must match the regex: [a-zA-Z_:][a-zA-Z0-9_:]*
However, Datadog allows characters such as a period (.) within its tag/label names, which is not allowed by Prometheus. The Datadog write proxy uses the following translation rules for metric names and tags (only the first two rules for metric names):
- Any underscore (_) characters are replaced by a double underscore
__ - Any period (.) characters are replaced by the string
_dot_ - Any dash (-) characters are replaced by the string
_dsh_ - Any slash (/) characters are replaced by the string
_sls_
Dependencies: The Datadog write proxy runs as a standalone binary and needs access to memcached server(s) to run.
InfluxDB Line protocol
The original InfluxDB Line protocol proxy was developed by Goutham Veeramachaneni at Grafana Labs and is being subsumed into the Mimir project. Initially, it will remain in the existing GitHub repository, and then it will be moved to the Mimir Proxies GitHub repository to sit alongside the Graphite and Datadog write proxies.
Influx Line Protocol metric:
weather,location=us-midwest temperature=82 1465839830100400200
In Prometheus:
weather_temperature{location="us-midwest",__proxy_source__="influx"}
Dependencies: The Influx write proxy runs as a standalone binary with no other dependencies.
Example deployment: ingesting Graphite metrics into Grafana Mimir
Here, we’ll walk you through how to configure and run the Graphite write proxy to talk to an existing Mimir installation running on port 9090 on localhost. If no existing Mimir installation is available or you would like to quickly install a test installation, then follow the Get started with Grafana Mimir documentation.
Gathering required information
To configure a write proxy, you need to know the following pieces of information:
- The TCP port that the write proxy should listen on
- The endpoint for remote writes within Mimir
The default TCP port for the write proxy is 8000; however, it is best to choose a unique non-default port, especially if you are going to be running multiple write proxies (Graphite, Datadog, Influx, etc.) on the same host.
If Mimir is configured to listen on port 9009 on localhost, then the remote write endpoint will be http://localhost:9009/api/v1/push.
Downloading and building
(Note: Pre-built binaries and Docker images are on our list of things to do.)
Clone the https://github.com/grafana/mimir-proxies repository and build it (a go development environment is required):
- go mod tidy
- make build
- make test
Assuming all goes well, the tests should pass and you will have a graphite-proxy-writes binary in the dist sub-directory.
Running the Graphite write proxy
You can now run the Graphite write proxy using the information gathered above:
dist/graphite-proxy-writes \
  -auth.enable=false \
  -server.http-listen-address 127.0.0.1 \
  -server.http-listen-port 8008 \
  -write-endpoint http://localhost:9009/api/v1/push
Example metric send
You can use the following command to send an example metric to the Graphite write proxy:
curl -H "Content-Type: application/json" "http://localhost:8008/graphite/metrics" -d '[{"Name": "AMetricName","Metric": "AMetricName.Foo.Bar","Interval": 10,"Value": 1000.123,"Unit": "unknown","Time": 1657179807,"Mtype": "gauge","interval": 10}]'
{ .overflow-wrap-anywhere }
You can check that the metrics have made it to Mimir by using Explore in Grafana.
For the Graphite write proxy, you can also use Carbon-Relay-NG to accept a wider range of Graphite formats (including plaintext over TCP). More detailed installation/usage instructions for the Graphite write proxy can be found on GitHub.
What’s next for Grafana Mimir
This is an initial experimental or “as is” release of the Graphite, Datadog, and Influx write proxies, hence the release via two different GitHub repositories. In time, the Influx write proxy will move from its original/current home to be consolidated in the Mimir proxies repository.
There is plenty of work planned to refactor the existing proxies and develop a common framework for creating future write proxies with less duplication and more boilerplate code. The existing proxies were developed internally by different teams, so in the process of consolidating them, we are adopting the best approaches from all three with future write proxies in mind. We consider this to be part of our technical debt and don’t want this to stagnate or rot.
Watch for upcoming improvements in many areas — logging, tracing, testing, maintainability, and more! After all, our goal is to be the best single tool to store all of your metrics.
If you have any suggestions or contributions for new proxies, formats, or protocols to support, we welcome issues or PRs on the Mimir proxies GitHub repository.
And if anything of this sounds interesting and you want to help build a truly ubiquitous metrics engine, we are hiring!
Grafana Cloud is the easiest way to get started with metrics, logs, traces, and dashboards. We have a generous free forever tier and plans for every use case. Sign up for free now!

