
How we improved Grafana Mimir query performance by up to 10x
Earlier this year we introduced the world to Grafana Mimir, a highly scalable open source time series database for Prometheus.
One of Mimir’s guarantees is 100% compatibility with PromQL, which it achieves by reusing the Prometheus PromQL engine. However, the execution of a query in the Prometheus PromQL engine is only performed in a single thread, so no matter how many CPU cores you throw at it, it will only ever use one core to run a single query. This makes implementation and maintenance of the engine easier over time, but unfortunately it’s slow for some high cardinality or CPU-intensive queries, where typically the query evaluation time increases in direct relation to the number of samples that need to process.
Mimir has a microservices-based architecture, and all of Mimir’s components are horizontally scalable. One of these components is the querier, which is the part that evaluates PromQL queries, fetching the most recent time series data from the ingesters and historical data from the long-term storage via the store-gateways.
As we scale and ingest more and more metrics, it becomes important to also ensure we can query them efficiently. That is, not just being able to do more queries (which is what increasing the number of querier replicas would traditionally achieve), but also being able to handle bigger and higher-cardinality queries without sacrificing performance.
To overcome the limitations of running in a single thread, while also continuing to use the same PromQL engine for compatibility, we introduced two sharding techniques in Grafana Mimir. Time splitting and query sharding allow us to execute a single query across multiple CPU cores and machines in parallel, and typically results in a 10x reduction in execution time for high cardinality and CPU-intensive queries.
Time splitting queries in Grafana Mimir
Time splitting is reasonably straightforward and does as the name suggests: The method entails splitting a range query by time and performing each partial query separately, thus balancing the load across multiple queriers. The results can then be joined back together for one continuous time.
A query is split by -query-frontend.split-queries-by-interval, which by default is 24 hours. So a simple query such as sum(rate(metric[5m])) across three days would be run on three different queriers (one for each day), with the results then concatenated together.
Query sharding in Grafana Mimir
Query sharding works by distributing a query across multiple queriers (one for each shard) and performing each partial query against a subset of series. The results can then be joined back together with the method depending on the type of aggregation in the query. The splitting and joining of the shards is performed by the query-frontend with each partial query then distributed to a querier.
Each shardable portion of a query may be split into -query-frontend.query-sharding-total-shards number of partial queries. For example, if this is set to 3, then sum(rate(metric[1m])) can be executed as:
sum(
  concat(
    sum(rate(metric{__query_shard__="1_of_3"}[1m]))
    sum(rate(metric{__query_shard__="2_of_3"}[1m]))
    sum(rate(metric{__query_shard__="3_of_3"}[1m]))
  )
)
An individual querier may then receive a partial query like sum(rate(metric{__query_shard__="2_of_3"}[1m])). The concat() annotation is used to show when partial query results are concatenated/merged by the query-frontend.
When the querier is fetching data for metric{__query_shard__="2_of_3"}, it knows to look only for metrics in the second shard out of three. The algorithm to check if a series belongs to the given shard is: series.hash() mod 3 == (2-1). Thus the querier returns a partial set of series as determined by the sharding.
Once all of the partial queries have completed, the results are then joined back together.
Query sharding also works in conjunction with the stored blocks sharded by the split-and-merge compactor. The advanced compactor shards series into blocks to overcome limitations of Prometheus’s TSDB format.
The querier is aware of the sharded blocks in the storage and is able to query only the blocks containing the metrics for that shard. This technique allows us to further speed up query execution because it better distributes the load across store-gateways. You can read more in our blog post about how the Mimir compactor works and learn about the benefits provided to query-sharding.
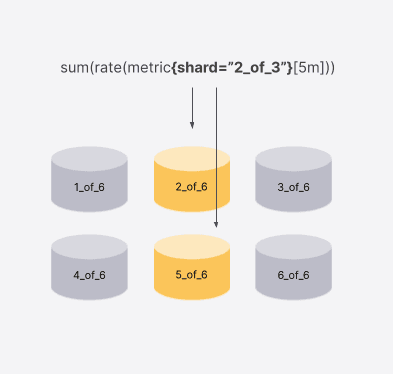
Extending the example for sharded storage: When running a query for the shard 2_of_3, if there are 6 shards in the storage, the querier will query only blocks 2 and 5 because it’s guaranteed they’re the only ones containing metrics for the query shard 2_of_3.
Types of shardable queries
Not all queries are inheritably shardable. However, even when the full query is not able to be sharded, the inner parts of a query may still be. In particular, associative aggregations (like sum, min, max, count, avg) are shardable, while some query functions (like absent, absent_over_time, histogram_quantile) are not.
The sum(rate(metric[5m])) example above is a fully shardable query. Below, we will take a look at two examples with a shard count of 3. All the partial queries that include a label selector __query_shard__ are executed in parallel.
Example: Inner part is shardable
histogram_quantile(0.99, sum by(le) (rate(metric[1m])))
is executed as:
histogram_quantile(0.99, sum by(le) (
  concat(
    sum by(le) (rate(metric{__query_shard__="1_of_3"}[1m]))
    sum by(le) (rate(metric{__query_shard__="2_of_3"}[1m]))
    sum by(le) (rate(metric{__query_shard__="3_of_3"}[1m]))
  )
))
Example : Query with two shardable portions
sum(rate(failed[1m])) / sum(rate(total[1m]))
is executed as:
sum(
  concat(
    sum (rate(failed{__query_shard__="1_of_3"}[1m]))
    sum (rate(failed{__query_shard__="2_of_3"}[1m]))
    sum (rate(failed{__query_shard__="3_of_3"}[1m]))
  )
)
/
sum(
  concat(
    sum (rate(total{__query_shard__="1_of_3"}[1m]))
    sum (rate(total{__query_shard__="2_of_3"}[1m]))
    sum (rate(total{__query_shard__="3_of_3"}[1m]))
  )
)
Example of time splitting and query sharding in Grafana Mimir
Now let’s take a look at an example of both techniques being applied together for sum(rate(metric[5m])).
If you run this over the last three days, Mimir splits the query into 3 x one-day queries, each one querying one different day. Each daily query is further accelerated using query sharding. We shard the metrics by hash, using the same hashing function used by the split-and-merge compactor, and run the query only on the respective shard.
All the generated partial queries (9 in this example) can be executed in parallel across the pool of queriers:

You may notice that even though -query-frontend.query-sharding-total-shards is set to 3 in the example, a total of 9 partial queries were generated and executed. This is because it is multiplied by the time splitting, but it may also be multiplied by the type of query and methods used. As such, -query-frontend.query-sharding-max-sharded-queries is used to cap the total number of partial queries generated (where the queries are split by time first and shards second).
Query performance benefits in Grafana Mimir
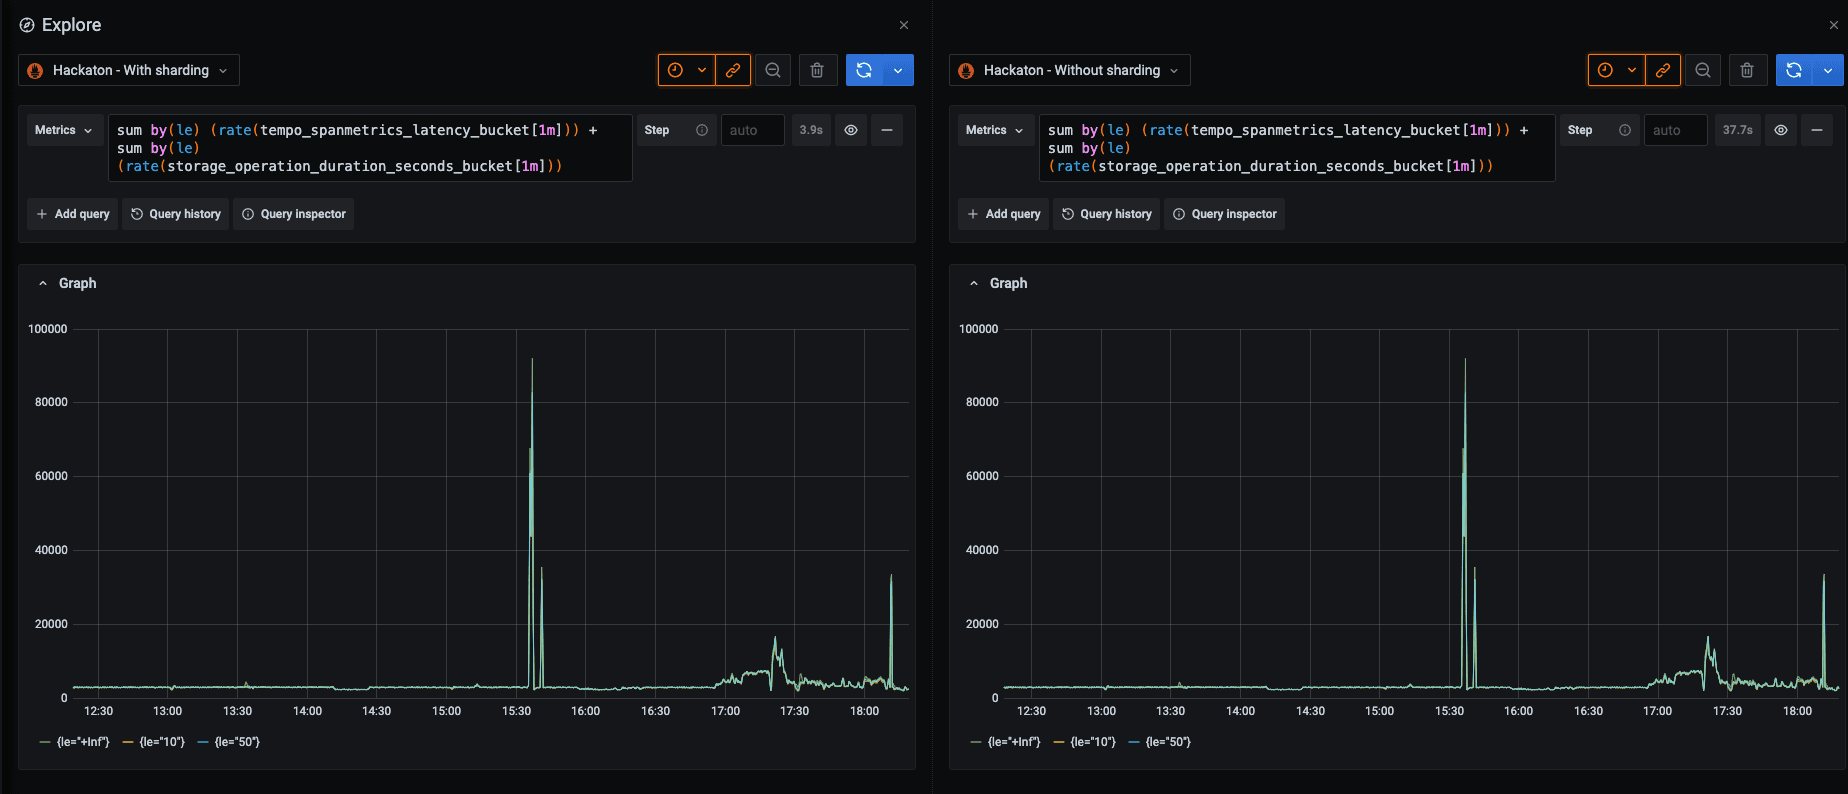
With query sharding alone, we are able to observe a 10x reduction in execution time for high cardinality and CPU-intensive queries.

For example, the screenshot above shows the same high cardinality query, running on the same Mimir cluster, with and without query sharding enabled. In this case, execution time was reduced from about 38s down to 4s.
At Grafana Labs, we use Grafana Mimir to power Grafana Cloud Metrics. Although not all queries are shardable, approximately 60% of all customer queries running across Grafana Cloud are sharded, which represents a huge performance benefit.

The Grafana dashboard above shows the percentage of queries in Grafana Cloud that have been sharded. Thus we can see on average how many queries are shardable, and therefore how often we get performance benefits.
Learn more about Grafana Mimir
We look forward to continuing our work to improve query performance and adding sharding support for more query types in Grafana Mimir.
You can learn more about query sharding and how to enable it in our Grafana Mimir query sharding documentation. You can also find out more about Grafana Mimir by watching our “Intro to Grafana Mimir” webinar on demand or reading more about Mimir on GitHub or grafana.com.
Grafana Cloud is the easiest way to get started with metrics, logs, traces, and dashboards. We have a generous free forever tier and plans for every use case. Sign up for free now!

