
How real-time Grafana dashboards and alerts combat climate change: Inside Apeel Sciences observability stack
Meet the newest changemakers making an impact in the current climate crisis: Apeel Sciences. The ag-tech company is on a mission to eliminate the 8 percent of greenhouse gas emissions caused by global food waste with their edible, plant-derived food coating, which keeps fruits and vegetables fresh for up to twice as long. And it’s working: From January 2019 to June 2021, Apeel helped save 42 million pieces of fruit from spoiling at retail locations, offsetting 10,000 metric tons of carbon dioxide emissions and conserving 4.7 billion liters of water.
In their recent GrafanaCONline 2022 talk titled “How Apeel Sciences uses Grafana to optimize its treatment processes and reduce food waste,” VP of Products Brian Sohmers and Software Engineer Bailey Heit shared how Grafana helps them monitor global production and operations, alert stakeholders when problems arise, and track throughput for higher efficiency.
Monitoring global equipment metrics with real-time Grafana dashboards
Apeel coatings work most effectively when they’re applied immediately to freshly harvested crops, so coating operation facilities and packing houses are located around the world.
Each packing house is equipped with sensors to track performance indicators like dryer temperature, flow rate, and water and gas usage. Apeel has implemented Grafana dashboards to quickly visualize these sensors at their facilities around the globe.
From their data lake in the cloud, data from various sensors is used to serve up real-time Grafana dashboards so the Apeel team can visualize and monitor equipment performance, saving field and equipment specialists time in identifying issues and troubleshooting problems.
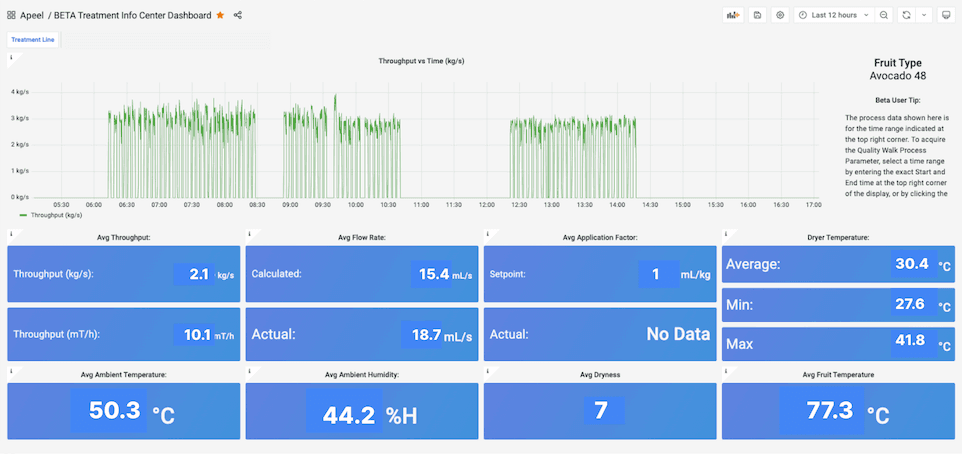
Above: Apeel’s real-time Grafana dashboards provide rich data on equipment performance that save field specialists valuable time. (Actual values have been replaced for confidentiality.)
And because Grafana provides both SSO capabilities and access control, operations teams from across the globe can collaborate and learn from each other by viewing these dashboards securely. “We were very pleasantly surprised to learn that Grafana not only supports SSO but can also allow external users in a secure and controlled manner so they are only provisioned to the data they should be seeing,” said Sohmers.
Integrating Grafana Alerting with Slack and tracking throughput via dashboards
In addition to using Grafana dashboards to visualize production metrics, Heit has implemented Grafana Alerting (previously referred to as Unified Alerting in Grafana 8) so team members are notified as soon as something goes amiss. By tracking key metrics like fruit surface temperature and creating Grafana Alerting queries that fire alerts whenever those metrics are out of spec, the team gets a much better understanding of what’s going on with equipment and production. “We’ve also integrated into Slack so that every time an alert fires, we get a notification. The field specialists and engineers can then go into Grafana and see exactly when the equipment started malfunctioning,” said Heit.
Apeel also uses Grafana to track throughput – the amount of fruits and vegetables coming down the production line within a specific time period. Heit has created custom visualizations in Grafana that showcase exactly how much produce is coming through the coating process within certain time intervals at every processing facility around the world.
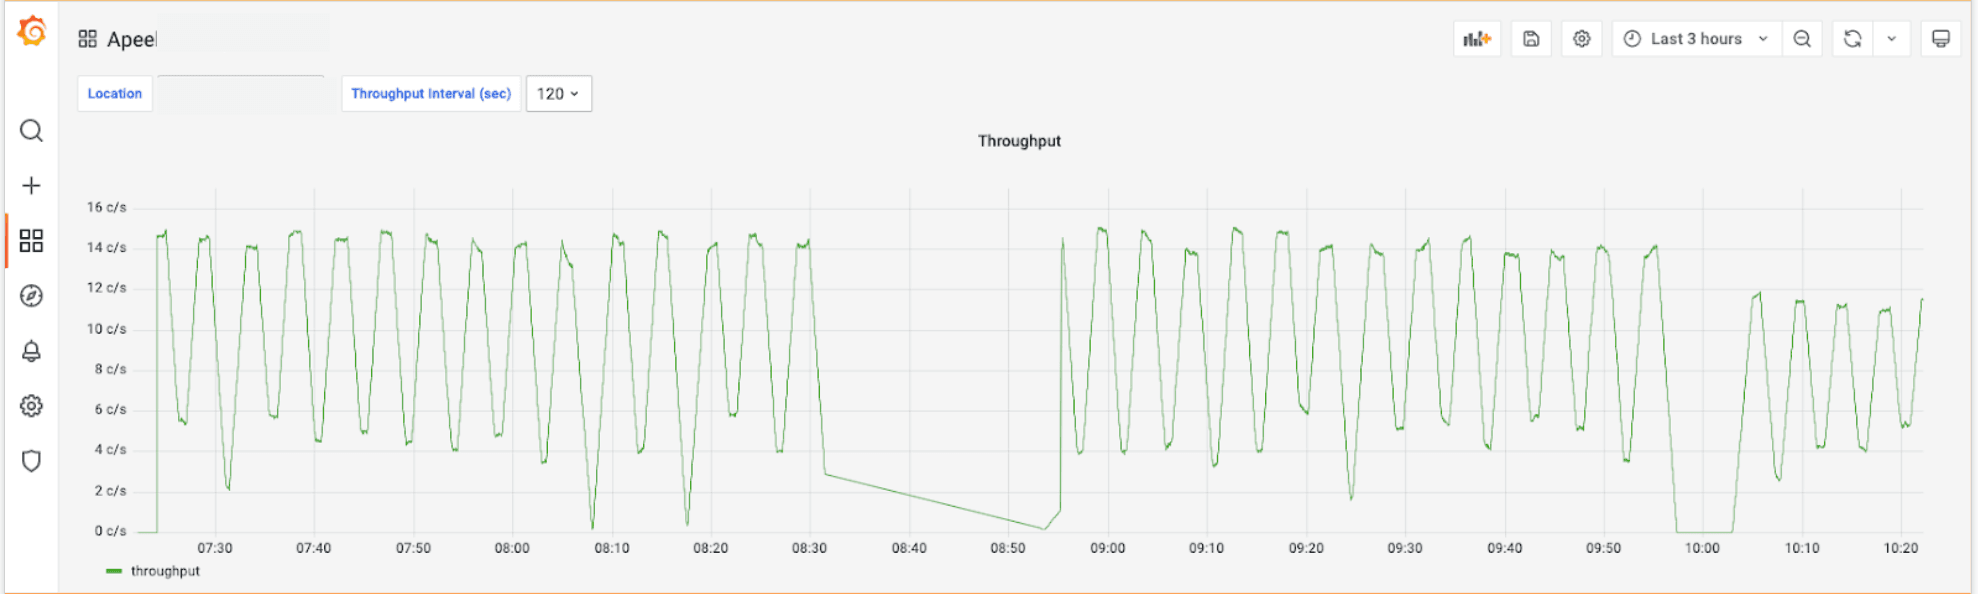
Above: Heit provided a demo of how Grafana visualizations help the Apeel team track throughput, which is the quantity of fruits and vegetables being processed within a specific amount of time at any given facility around the world.
Users can drill down within this visualization to get information, for example, about how many avocados are coming through the line within one second, 30 seconds, three minutes – whatever interval they need to investigate. This gives the team vital insight into production rates, helping them to assess efficiency and optimize for improvements that help get to the core of the global food waste problem.
“Our current practices and food system is unsustainable,” said Sohmers. “It’s absolutely imperative that we eliminate food waste so that we can feed our current and future global populations.”
Watch the full session to learn more about the details behind Apeel Sciences’ system architecture and their effective Grafana Alerting setup. All our sessions from GrafanaCONline 2022 are now available on demand.

