
New in Grafana 9: Search Grafana panel titles, preview dashboards, better navigation, and more!
The entire team at Grafana Labs is thrilled to bring the community our latest and greatest release, Grafana 9, which we introduced at GrafanaCONline this year. In addition to introducing the Grafana Loki query builder, a new command palette, and making role-based access control GA, we also rolled out major updates to the navigation and search functionality in Grafana with the aim of continuing to support the community and users throughout their observability journey.
Grafana 9 navigation
In Grafana 9, we invested our resources and efforts in improving the navigation within the Grafana UI. The goal was to make navigating through Grafana more intuitive and help teams improve how they share data across their organization.
Enhanced vertical navigation bar
First, we’ve updated our vertical navigation bar, making it bigger and easier to read. Users are now able to expand the vertical navigation bar to have a better overview of all of Grafana’s features and their installed integrations.

Starred dashboards in the navigation (beta)
Additionally, users can now save and access their favorite visualizations right from Grafana’s navigation: There is a new section for starred dashboards that users can access from the vertical navigation bar.
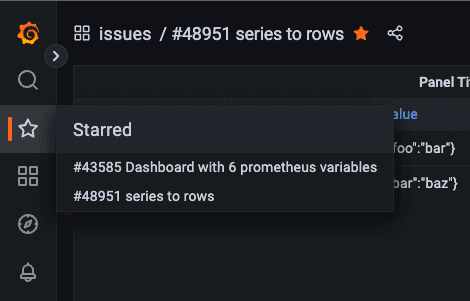
Note: Starred dashboards in the navigation is currently an opt-in feature and can only be accessed by enabling the savedItems feature flag. Read more about feature toggles in our Grafana documentation.
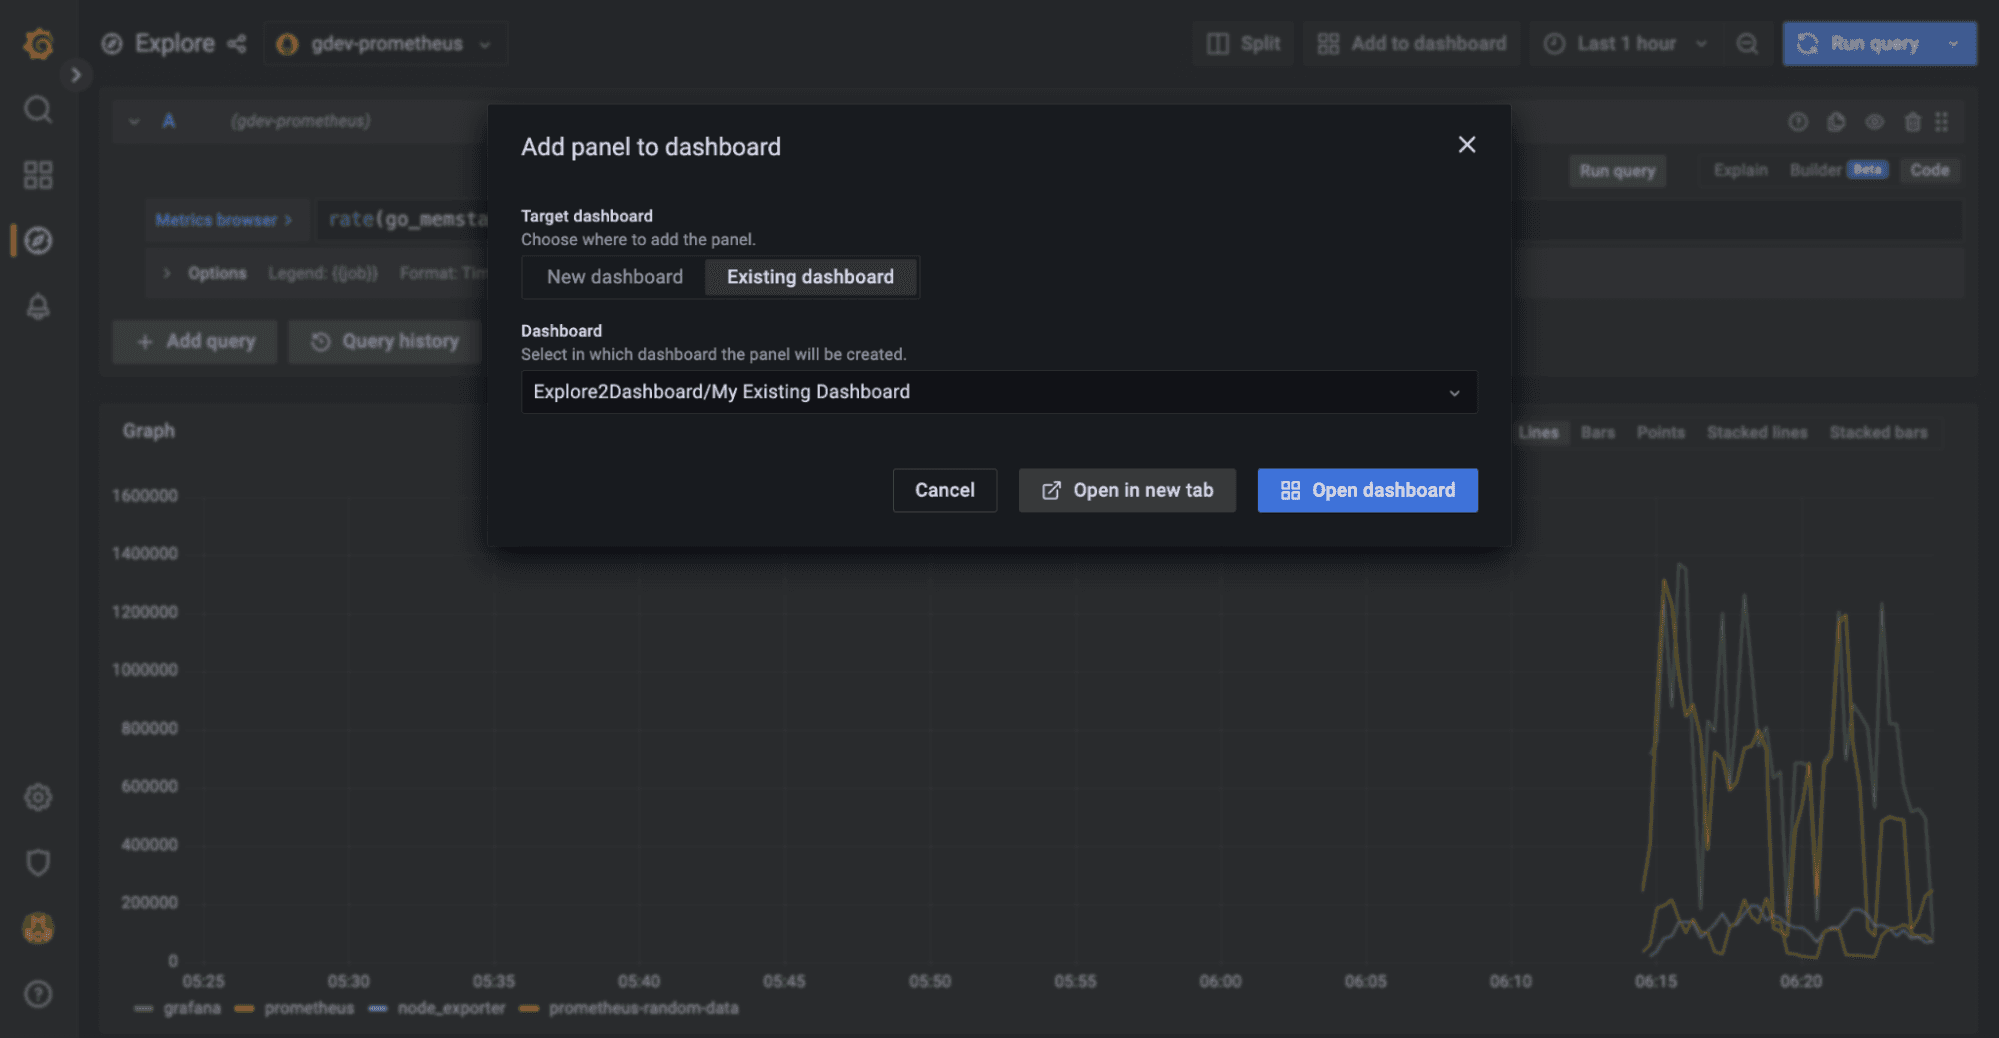
Create panels and dashboards in Explore
With Grafana 9, it is now possible to create panels and/or dashboards directly from the Explore module. When clicking on the Add to dashboard button in the Explore toolbar, users can now create a panel in a new dashboard or within an existing one. The generated panel contains all of the panel’s queries and a default visualization automatically picked from the current results shown in Explore.
Improvements to Grafana search
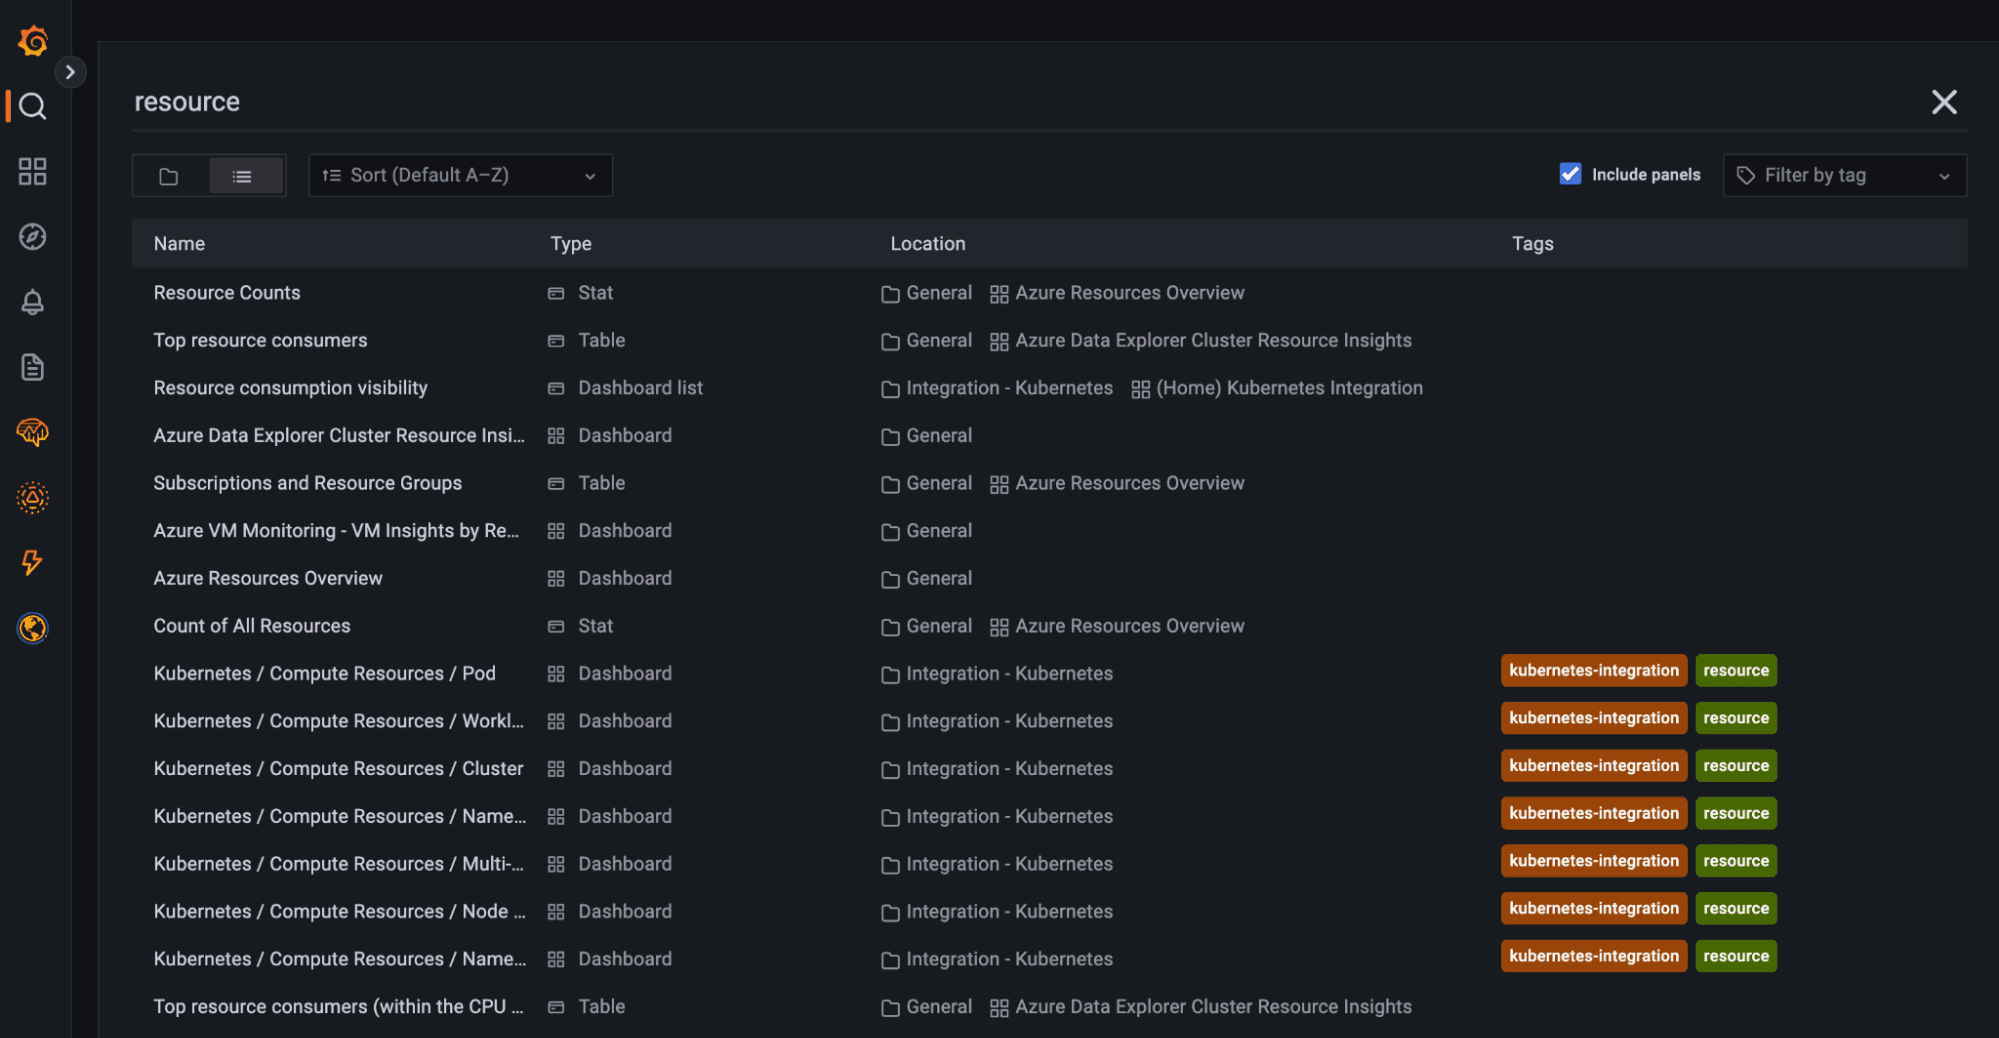
Search by panel title (beta)
In addition to searching dashboards by title, you can now search by panel title as well! If a panel title matches your search query, it will be displayed in the search results.
Overall search performance has also improved: Both querying and sorting have become faster, and results are more relevant because Grafana is now powered by full-text search techniques.
Note: This is currently an opt-in feature for Grafana OSS. It can be accessed by enabling the panelTitleSearch feature flag. Read more about feature toggles.
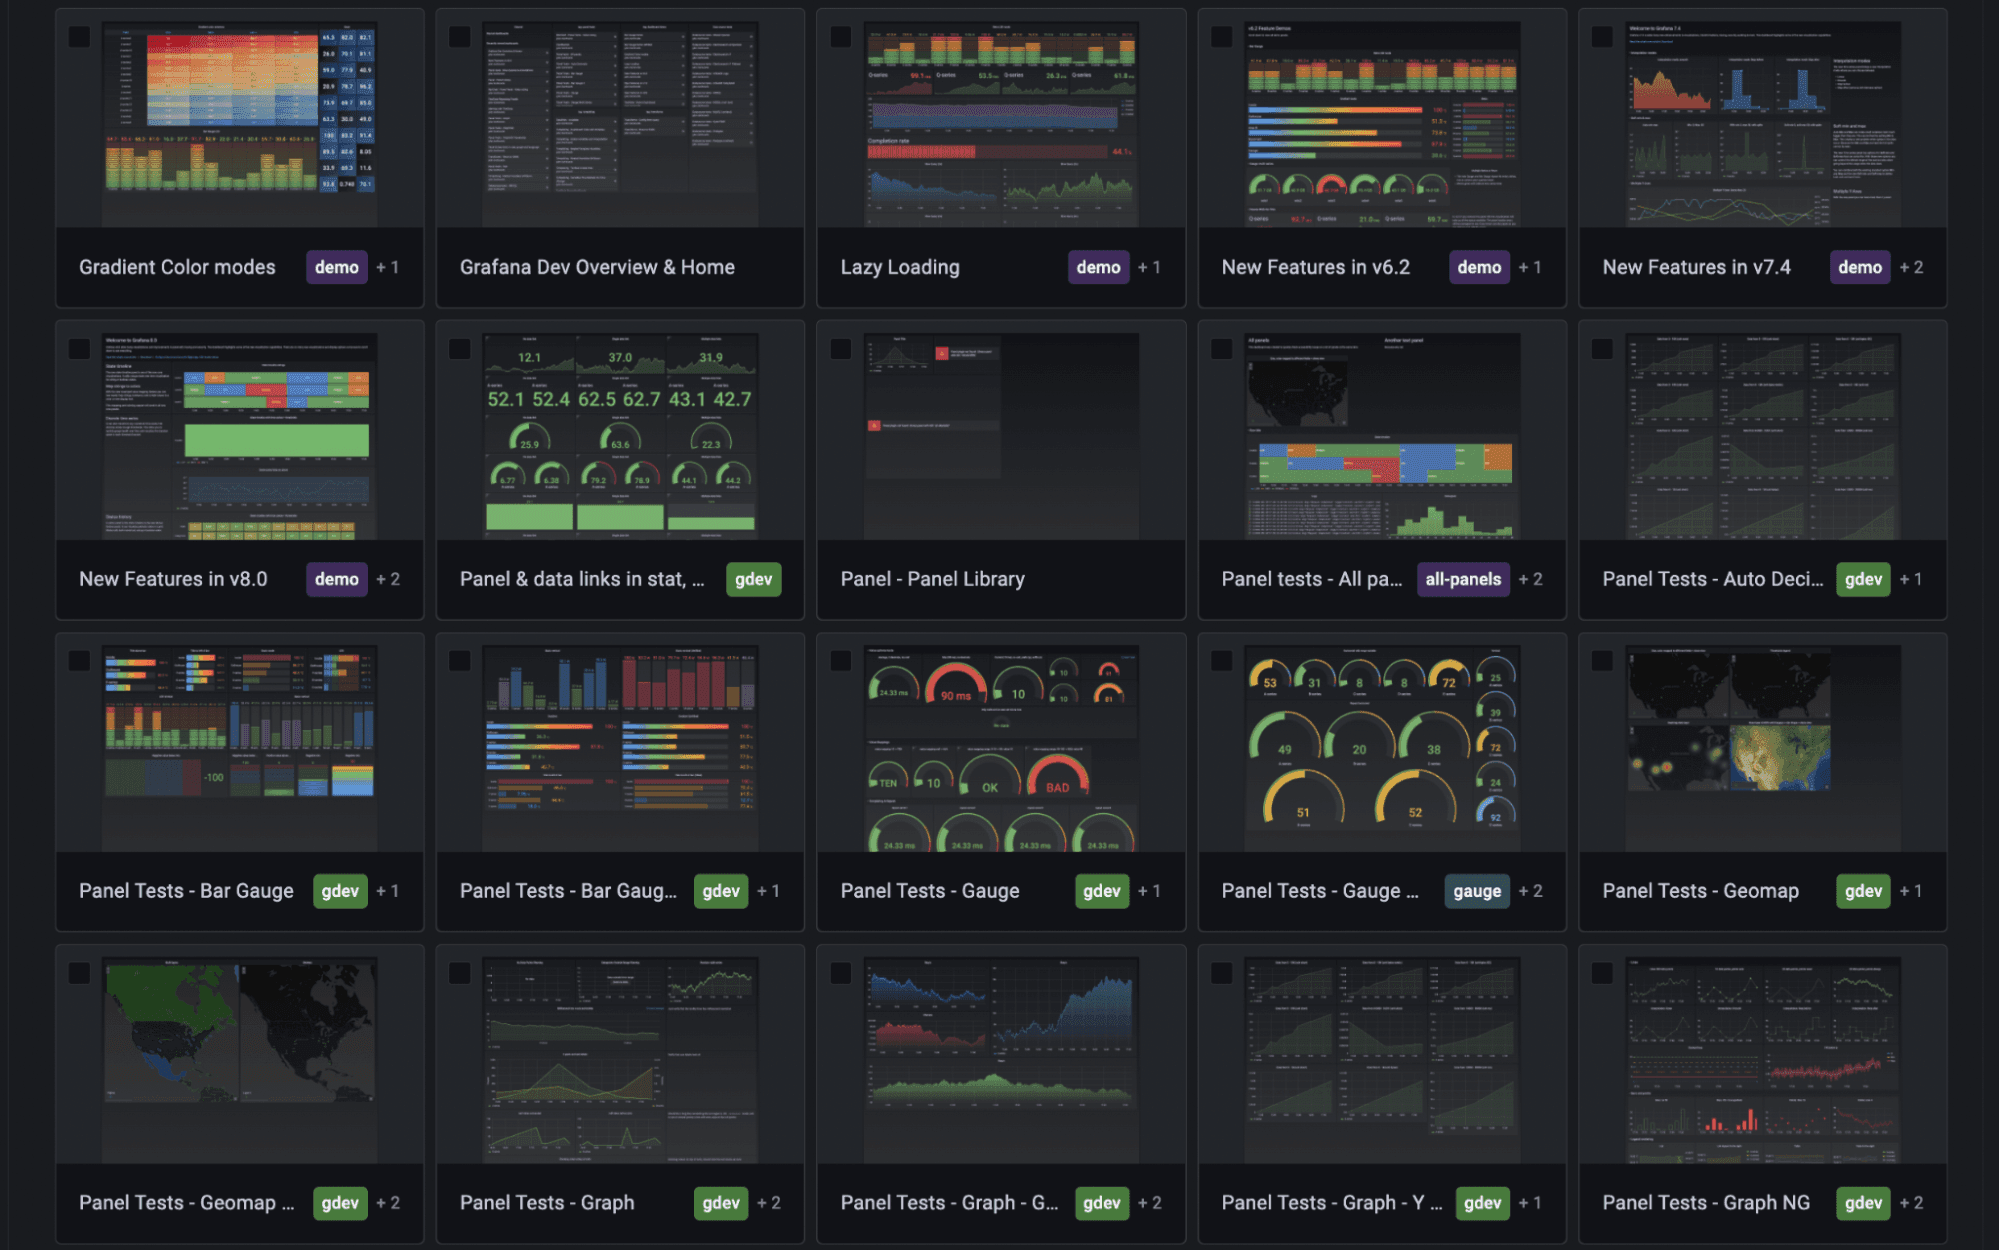
Dashboards preview (beta)
Another way that searching dashboards has become easier is thanks to dashboard previews. Dashboard previews provide an overview of all available dashboards and can help you quickly find the right dashboard when the dashboard names aren’t enough. Fun fact: This feature was developed by a team of Grafanistas during one of our company-wide Grafana Labs hackathons!
Note: This is currently an opt-in feature for Grafana OSS. It can be accessed by enabling the dashboardPreviews feature flag. Refer to the Dashboard previews docs for further details.
Tell us what you think of Grafana 9!
The Grafana 9 navigation and search updates will make Grafana even easier to use for both individuals and teams. If you would like to access any of the beta features on Grafana Cloud, please reach out to Grafana Labs customer support.
For a demo of all the newest features in Grafana 9, including the new Grafana Loki query builder and the command palette, you can watch our “Deep dive into Grafana 9” session from GrafanaCONline 2022 on demand.
Grafanistas continue to innovate to improve performance and usability, but we would still love the community’s feedback! Contact us directly and let us know your thoughts on Grafana’s UX in our GitHub discussions or in the Grafana Labs Community Slack.
Grafana Cloud is the easiest way to get started with metrics, logs, traces, and dashboards. We have a generous free forever tier and plans for every use case. Sign up for free now!

