
Monitoring robots in real time with Grafana and other cloud native solutions
Edgardo Peregrino is a freelance software developer, writer, maker and IT technician.
For six years now, I’ve been a passionate maker with a focus on robotics. Recently, I entered the world of cloud native computing, which has allowed me to integrate maker projects with open source tools such as Grafana, Prometheus, and Jaeger.
I’ve embraced open source since 2016 when I bought my first Raspberry Pi 3 and learned how to blink an LED for the first time. Since then, I’ve learned how to control robots using items such as a keyboard, an Android phone, and an Intel Neural Compute Stick 2 for object detection. I decided to add real time monitoring with Grafana to make sure my robots were running at all times and that there was very minimal lag between requests. There really haven’t been any attempts at this, so I felt it was up to me to take the challenge head-on.
Even though I’m doing this as a hobby, monitoring is especially important for anyone who is using an industrial robot working in an assembly factory and has a goal of 100% uptime and minimal lag between requests. It’s also key when you are dealing with very precise movements and must avoid any errors.
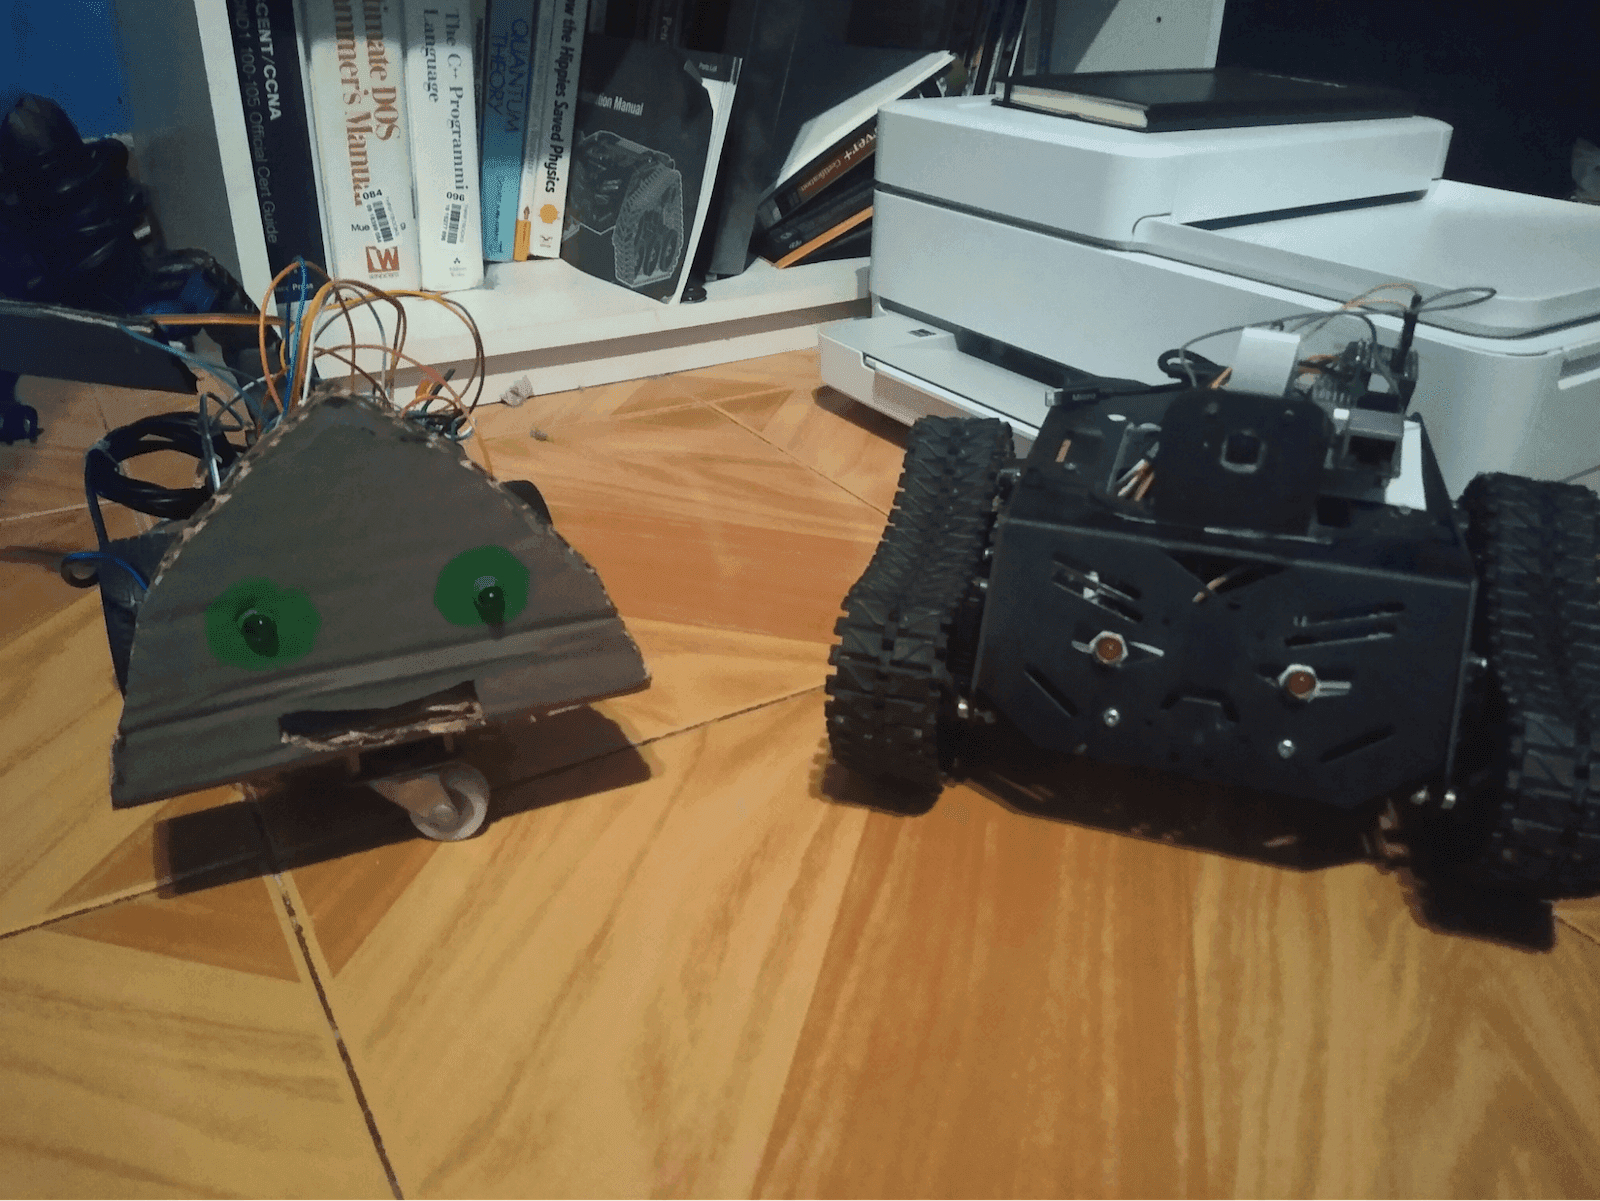
The projects I’ve been working on involve my two robots: Linus (below left) and Torvalds (below right). Yes, I named them after the creator of Linux because he inspired me to get into open source.
Let me take you through my experience setting up monitoring and what I learned along the way.
Starting out
My journey began last year after I successfully created a Graphical User Interface (GUI) to control robots. At the time, I was looking for new ways to control them — originally, I had done keyboard control using a Bluetooth Keyboard and also an Android Smartphone as the robot controller. I came across an article that showed how to use the Flask Python library to create web applications, so I tried out the tutorial and that got me going.
I messed around with some sample applications, then decided to integrate web development with controlling LEDs, servos, and motors. After that worked, I moved on to robotics. The tutorials I discovered (such as this one that creates a web server and uses LEDs and a button) were very old and used the RPi.GPIO library rather than the newer GPIO Zero library. Since there was no help available, I decided to figure things out on my own. I was able to successfully control the GPIO pins by experimenting with GPIO Zero rather than the older RPi.GPIO library.
One thing that helped me a lot with controlling my robots was jQuery, since it allowed me to move a robot only when the left mouse button was held down. It was the missing piece that I needed to create a functioning robot controller.
Up until then I had been working with one robot, so I decided to expand the project to two robots. Why? Because controlling one robot has been done many times, and being able to control two or more robots is far more helpful.
Things began to pick up last June, when I was accepted into the SUSE Scholarship program set up by Udacity. The program focused on cloud native tools like Docker, Kubernetes, and ArgoCD, and I was excited when I learned how to deploy a Flask application with these tools. I decided to take my existing sample applications and experimented with these additional tools to deploy my existing applications to the cloud.
This GitHub repo shows my work and this demo video shows my robots in action.
Taking it to the next level
Even though everything had been a success, something was still missing. I thought to myself, How can I take this much further?
That answer came in the form of another opportunity last August, when I was accepted into the Cloud Native Application Architecture Nanodegree Program. For three months, I learned about message passing and monitoring services, as well as securing services. That’s also when I learned about how to use services such as Grafana, Prometheus, and Jaeger.
After completing the course, I created a small test application. My goal was to first monitor a small application and then build up to my Monitoring System. My intention was to apply Grafana, Prometheus, and Jaeger to my applications and learn how those cloud native tools work. To do that, I had to use the Prometheus Flask Exporter library in Python in order for the metrics to be consumed by Prometheus and then presented as charts in Grafana. I also decided to integrate Jaeger for this test application.
To install Jaeger, Prometheus, and Grafana, I relied on Helm charts, then made sure the services were running. To integrate Jaeger with Grafana, I needed the correct query agent. That required some good ol’ shell scripting on Linux. (FYI, I did all my experiments on my Ubuntu 20.04 PC and installed Docker since that was required.) I originally used Kind for my tests, but for the final product I used k3s.
I started small by monitoring a basic Flask application that blinked an LED. After that, I moved to controlling two servo motors, then to controlling a single DC motor with speed control. Finally, it was time to test my robot Torvalds. Once I knew everything was working well, I decided to take my dual robot application and make some needed changes to the base code.
It took several steps to get this application running, so I’m going to address each layer to explain how it all works.
The base application
This is the application that runs my robots. The image below shows a screenshot of the application.

The Docker layer
This is where the application is packaged and can be run as a container. It’s necessary because in the next step, the Docker image is deployed using Kubernetes.
The schematic below shows how Jaeger, Prometheus, and Grafana are deployed. Jaeger and Prometheus collect the data from the application, then display it as human-readable charts.
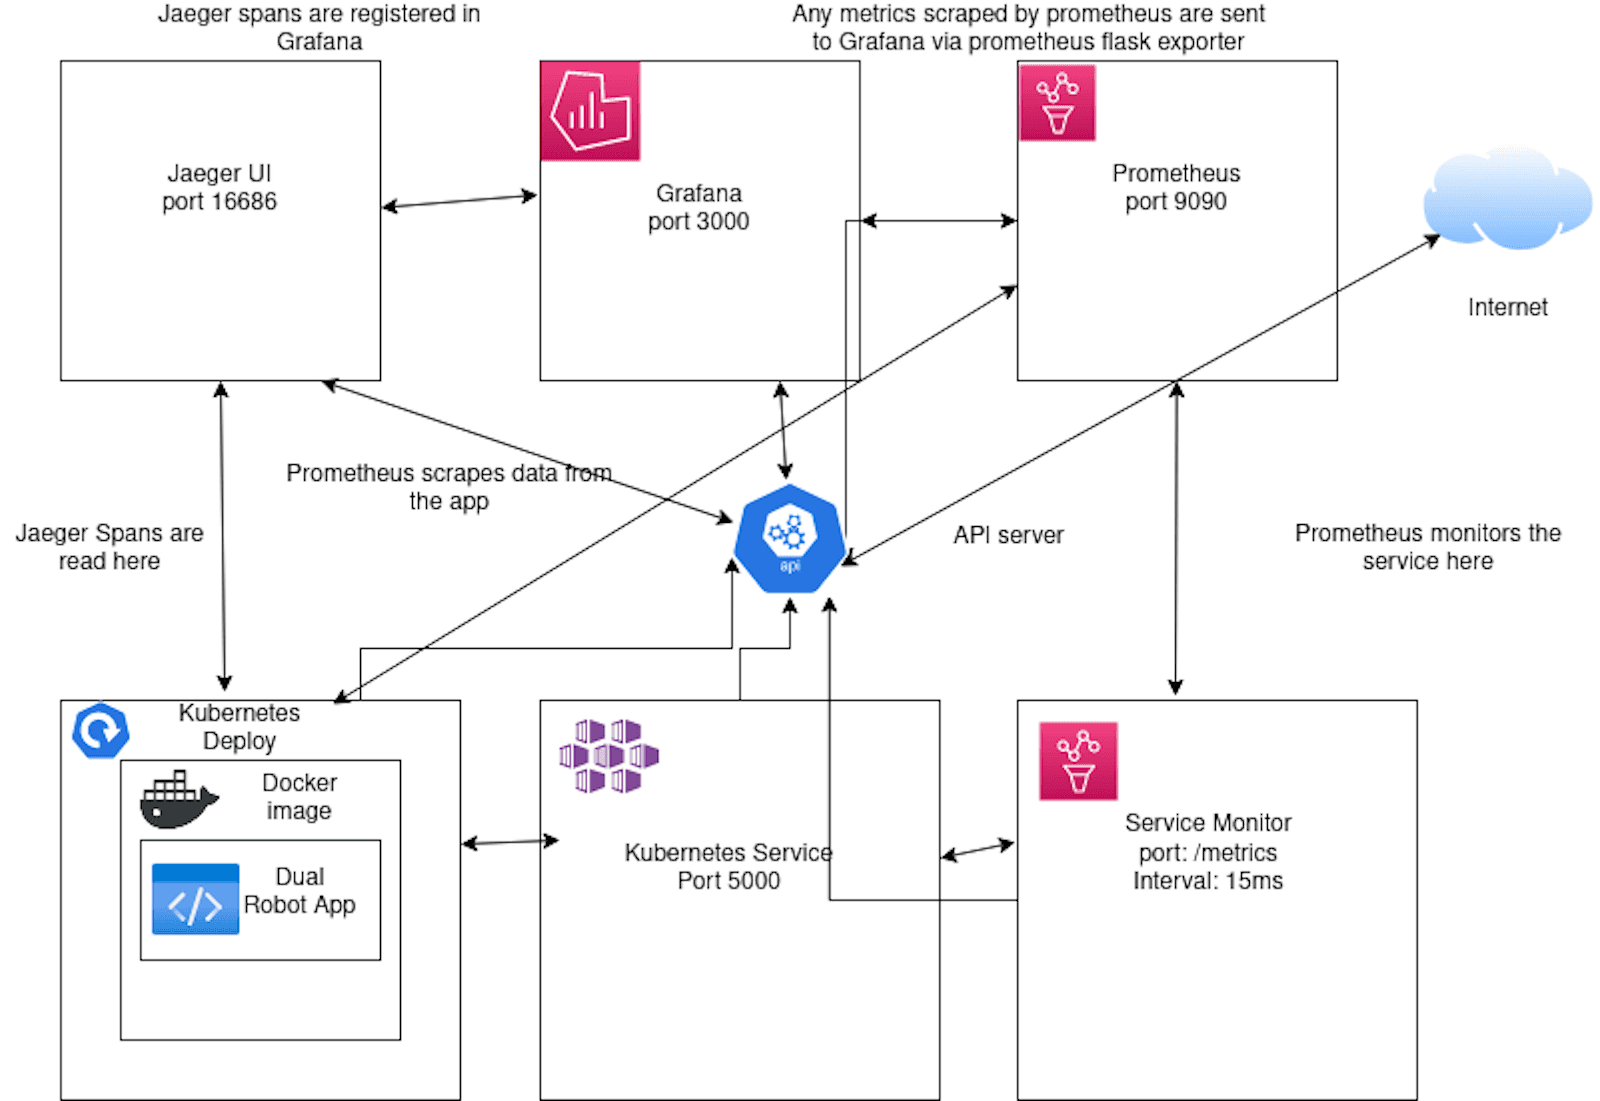
With Jaeger, anytime one of the eyes of either Linus or Torvalds is blinked, a span is triggered and sent to Grafana for consumption. I’m also able to use Jaeger to trigger a span any time Linus’ arm moves. This can be useful for debugging any issue and making sure the robots are up and running.
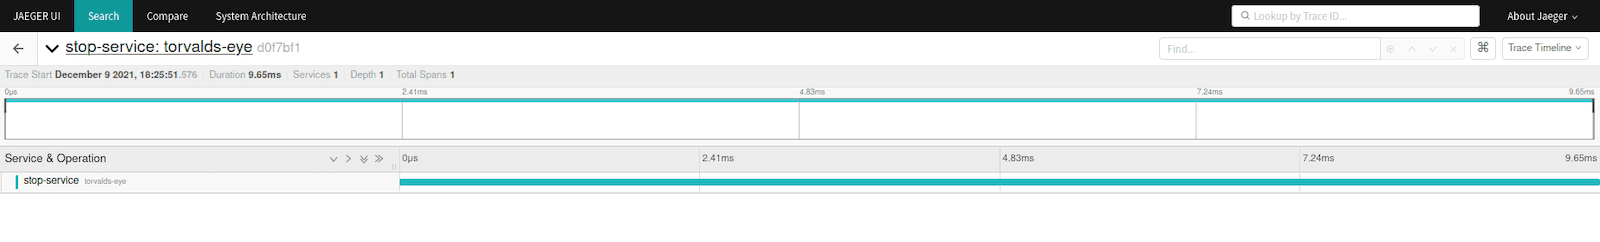
Here, you can see a sample span being detected:
As I mentioned earlier, Prometheus Flask Exporter was necessary so Prometheus could consume the data produced by the application and present it as charts in Grafana. In order for Prometheus to consume the metrics in the application, I had to make sure all the services were running and that I ran my application that was deployed using a Kubernetes cluster.
Once I had the cluster, I pointed my browser to localhost and port 5000, then moved the robots around. That created data Prometheus and Jaeger could consume and send to Grafana.
The dashboard
When I was sure I had enough sample data, I created my Grafana dashboard (below) and saw the data being displayed as different charts.

In this dashboard, I’m visualizing:
- Jaeger spans
- Total requests per second
- Average response time
- Memory usage
- Processor utilization
- Requests per second
- Kubernetes pod uptime
After setting that up, I moved my robots again to make sure the charts were working properly and I could see the data update in real time. I knew then that I had a winner.
Robotics and cloud native computing
Using Grafana to monitor applications in real time and applying that to maker projects such as robotics has been a great experience and a journey to understand how Prometheus, Grafana, and Jaeger work. It also helped me learn more about cloud native computing.
Grafana is a great tool to create dashboards for your applications and can be utilized to monitor any issues with your applications. Using Grafana dashboards with maker projects shows users how to diagnose issues such as errors, downtime, and connectivity issues. One thing I would love to do in the future is run this application using a Raspberry Pi cluster running k3s.
I hope that learning about my project inspires you to experiment on your own and take on new challenges that no one else has tried before. If you’d like to learn more about my dual robot monitoring, check out the GitHub repo and this demo video, which shows the final product in action.

